M2 Growth Rate Slightly Above Long-Term Average...On Par with Previous Rate Cut Cycles
Large Inflow of Funds Outside M2 Scope into M2 Products like ETFs Drives "Technical Increase"
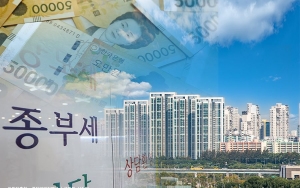
Demand Concentrates in Areas like Gangnam, Seoul...Past Accumulated
In response to some claims that “excessive liquidity in the market has recently pushed up housing prices in the Seoul metropolitan area and the exchange rate,” the Bank of Korea pointed out that such views are “overinterpretations.” The central bank explained that the recent pace of liquidity growth is in line with the average level during previous interest rate cut cycles, and corresponds to the growth of the real economy and asset markets.
The Bank of Korea also stated that the increase in broad money (M2) should be understood comprehensively, considering several factors: a technical rise as individuals sold domestic stocks-classified as non-monetary assets-and purchased investment securities such as Exchange-Traded Funds (ETFs), and the fact that various factors besides new liquidity contributed to the rise in housing prices and the exchange rate. The Bank emphasized that relying solely on specific monetary indicators like M2 could obscure the essence of the issue, and that it is important to examine a wide range of indicators, including other monetary aggregates and the Financial Conditions Index (FCI).
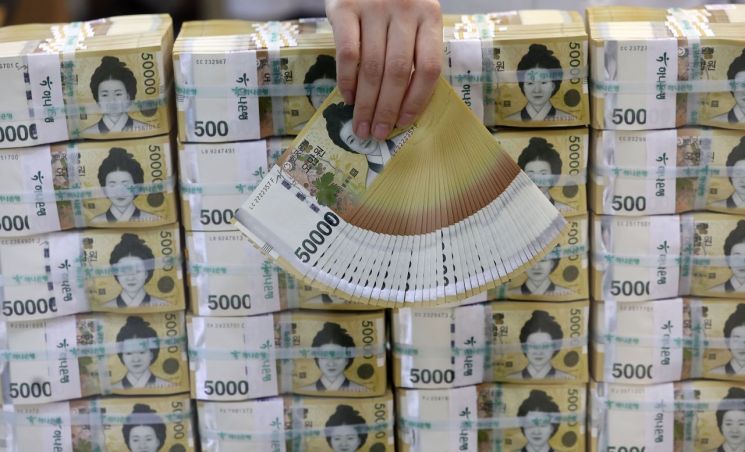 An employee is organizing 50,000 won bills at the Counterfeit Response Center of Hana Bank headquarters in Euljiro, Jung-gu, Seoul. Photo by Yonhap News Agency
"M2 up 8.5% in September... In Line with Past Rate Cut Cycles"
On December 16, the Bank of Korea posted “Understanding the Recent Liquidity Situation” on its official blog, reiterating these points. Liquidity refers to the total amount of money available for economic activities such as consumption, investment, and financial transactions. The scope of monetary aggregates broadens in the order of narrow money (M1), M2, liquidity of financial institutions (Lf), and broad liquidity (L). These indicators showed a modest upward trend from the end of 2023, with the pace of increase accelerating in the second half of this year. As of September, the M2 growth rate rose to 8.5% year-on-year, while Lf and L also increased to 8.0% and 7.2%, respectively.
This was due to several factors: the impact of four policy rate cuts since October of last year, which affected private credit with a time lag; increased inflows of liquidity from abroad as the current account surplus widened; and a rise in government bond issuance due to expanded fiscal spending. By supply channel, corporate sector contributed the most to total money supply (based on a 6.6% total credit growth rate in September) at 38%, followed by the household sector (16%), overseas sector (16%), and government sector (9%).
Park Sungjin, Head of the Market Operations Team at the Bank of Korea’s Financial Markets Department, stated, “The recent pace of liquidity growth (M2 8.5%, Lf 8.0%) is only slightly above the long-term average (7.4% and 7.8%, respectively), and the speed of increase is average compared to previous rate cut cycles.” Comparing this rate cut cycle to the three previous ones since the global financial crisis, the cumulative M2 growth rate this time is 8.7%, which is higher than in 2012 (5.9%) but significantly lower than in 2014 (10.5%) and 2019 (10.8%).Park added, “Given the growth of the real economy and asset markets, liquidity does not appear excessive. The ratio of M2 to nominal GDP remains stable at its long-term trend, and the level of liquidity relative to the scale of asset transactions has declined since the end of 2023, approaching its long-term trend.”

"Technical Factors: Individuals Selling Stocks and Buying ETFs Drove M2 Increase"
The recent increase in M2 is also attributed to technical factors such as changes in the composition of monetary aggregates. The flow of market liquidity shows that funds previously outside the scope of M2 have been flowing into M2 products such as ETFs and other investment securities, becoming a major driver of M2 growth. From January to September this year, the share of “Lf products not included in M2” and “L products not included in Lf” in the increase of liquidity (L) shrank considerably, while the share of M2 expanded significantly.Park explained, “Since May, as stock prices rose, individuals made substantial net sales of domestic stocks-which are not included in any monetary aggregate-and a portion of these proceeds flowed into investment securities such as ETFs, thereby accelerating the growth of M2.”
Such investment securities, which are sensitive to changes in financial market conditions, accounted for 32.1% of the M2 increase (8.5%) in September. Park noted, “Major countries including the United States do not include investment securities in M2, so interpreting Korea’s liquidity situation based solely on the M2 growth rate is misleading.” He added, “The Bank of Korea is working on revising monetary aggregates to exclude investment securities from M2, reflecting new international standards (IMF revisions). Under the revised standard, the M2 growth rate for September would be in the mid-5% range, significantly lower than the current figure.”

"Is Korea’s M2 Growth Rate Double That of the U.S.? A Long-Term Perspective Is Needed"
There are also explanations that the claim-Korea’s M2 growth rate is nearly double that of the United States-can only be properly understood from a long-term perspective. Park said, “As of September, Korea’s M2 growth rate (8.5%, or mid-5% after the revision) is indeed higher than the U.S. (4.5%), but the year-on-year M2 growth rate only reflects liquidity changes over the past year and does not capture all differences in the financial and economic environments of the two countries over a longer period.”
Immediately after COVID-19, the United States implemented quantitative easing (QE) and a zero interest rate policy, resulting in a surge in money supply and a sharp rise in inflation. To address these side effects, the U.S. responded with an unprecedented rapid policy rate hike (5.25 percentage points) and quantitative tightening (QT) from March 2022. As a result, U.S. M2 decreased unusually for 15 months from December 2022 to February 2024, and this effect is still ongoing. Park noted,“If we expand the timeframe to start from March 2020, the cumulative M2 growth rates for Korea and the U.S. are 49.8% and 43.7%, respectively, which is not a significant difference. Considering that investment securities are excluded from U.S. M2,Korea’s M2 growth is broadly similar to that of the United States.”
 The exchange rate is displayed at a currency exchange booth on Myeongdong Street in Jung-gu, Seoul. Photo by Yonhap News Agency
Despite Slower Household Lending, Demand for “One Smart Home” Surges... Accumulated Past Liquidity Flows into Real Estate
The recent rise in housing prices in the Seoul metropolitan area and the won-dollar exchange rate is also the result of a complex interplay of various factors, making it unreasonable to attribute this solely to increased liquidity. Park explained, “Looking at the long-term trends of money supply and housing prices, they generally move together and influence each other, rather than having a clear causal relationship.” Increased liquidity may exert upward pressure on housing prices by flowing into the housing market, but conversely, during periods of rising housing prices, increased demand for home purchase loans can also expand liquidity.
He added, “It is difficult to explain the recent rise in metropolitan housing prices solely as a liquidity effect, given the deepening polarization between the Seoul metropolitan area and other regions, and the slowdown in household lending due to macroprudential policies. Rather, the main factors are concerns about supply shortages and a preference for ‘one smart home,’ leading to concentrated demand and price expectations in specific areas.” In particular, in core areas of Seoul, including the three Gangnam districts (Gangnam, Seocho, and Songpa), the proportion of cash purchases without loans has increased significantly, indicating that accumulated liquidity from the past-rather than newly supplied liquidity-is flowing into the metropolitan housing market in search of returns.
As for the exchange rate, the Bank of Korea assessed that factors such as increased overseas securities investment by residents and stronger foreign currency holdings by exporting companies have played a greater role than liquidity conditions.
Park concluded, “Concerns that excessive liquidity is driving up asset prices and causing relative weakness in the won are somewhat overstated when considering the overall context of domestic and international monetary policy, real economic conditions, and changes in capital flows.” He emphasized, “Especially in times of instability in monetary aggregates due to changes in their composition, we should not rely solely on specific indicators like M2, but rather consider a variety of indicators including other monetary aggregates and the Financial Conditions Index.” He cautioned that attributing the rise in asset prices and the exchange rate solely to increased liquidity could obscure the essence of the problem and hinder effective solutions.
© The Asia Business Daily(www.asiae.co.kr). All rights reserved.
![Clutching a Stolen Dior Bag, Saying "I Hate Being Poor but Real"... The Grotesque Con of a "Human Knockoff" [Slate]](https://cwcontent.asiae.co.kr/asiaresize/183/2026021902243444107_1771435474.jpg)


