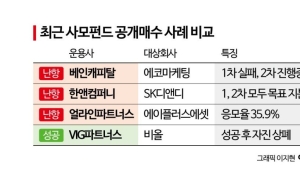
Actual Annual Leave Used: 11.63 Days
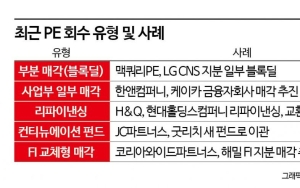
Desired Average Working Hours: 36.70 Hours

It was found that out of the average 17 days of annual leave that office workers receive, 5 days go unused. This is due to staff shortages within companies and pressure from supervisors.
According to the "2022 National Work-Life Balance Survey" (by Byun Sujeong et al.) conducted by the Korea Institute for Health and Social Affairs on the 19th, an online survey was conducted from September 20 to October 7 last year targeting 22,000 people nationwide aged 19 to 59 (17,510 employed and 4,490 unemployed). Among wage workers with designated annual leave, the average number of annual leave days (as of 2021) was 17.03 days. However, the actual number of annual leave days used was 11.63 days, showing a gap of over 5 days from the available leave.
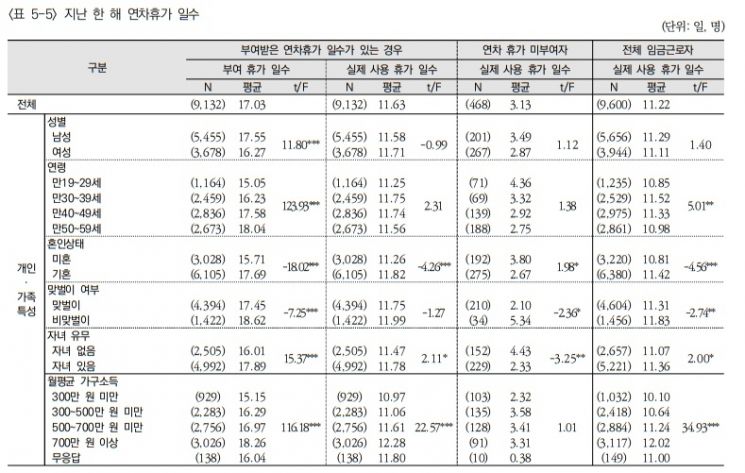
Although the number of annual leave days naturally increased over time after joining the company, there was little difference in leave usage by age group. Furthermore, while most employed workers were granted annual leave, 468 people had no designated annual leave. In these cases, the average annual leave used was only 3.13 days.
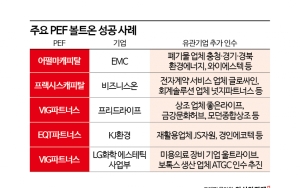
The most common reason for not using all annual leave was "lack of substitute personnel" (18.3%). This was followed by "excessive workload" (17.6%), "pressure from supervisors" (11.4%), and "organizational atmosphere" (5.1%). More than half of office workers wanted to take leave but could not.
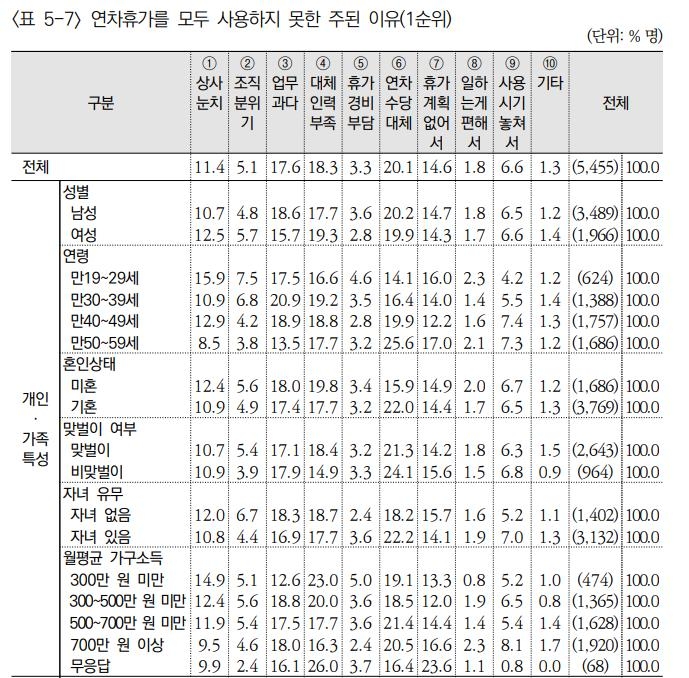
Additionally, 20.1% responded that they did not use leave because they wanted to receive "annual leave allowance," and 14.6% said it was because they had "no plans for leave." 1.8% answered that "working was more comfortable."
The response "to receive annual leave allowance" showed significant differences by age group: 25.6% for those in their 50s and 14.1% for those aged 19 to 29. For those in their 30s, it was 16.4%, and for those in their 40s, 19.9%.
Average Desired Working Hours: 36.70 Hours
Amid ongoing discussions on reforming working hours systems, the desired working hours were found to be 4 hours less than actual working hours.
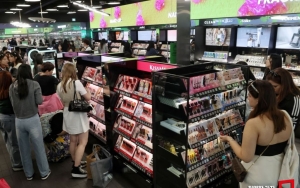
 Seoul Mapo-gu Seoul Western Employment Welfare Plus Center.
 [Photo by Yonhap News] (This photo is not directly related to the article)
When asked how many hours they would like to work per week if they could freely choose their working hours under the premise of earning a living, the average was 36.70 hours. This is about 4 hours less than actual working hours. Women (34.28 hours) desired shorter working hours than men (36.68 hours), and those in their 20s (34.97 hours) preferred shorter hours than those aged 30 and above (36 hours).
Those in the manufacturing sector hoped to work relatively longer hours (39.07 hours), whereas those in health care, social welfare, and educational services desired 34.86 hours, showing a gap. Even among groups currently working more than 52 hours, the desired working hours were 44.17 hours. The Korea Institute for Health and Social Affairs noted, "There is a significant gap between reality and desire among groups working long hours."
Break time, including meal time, was surveyed at an average of 64.45 minutes. The research team pointed out that groups working more than 52 hours per week had shorter break times than those working 41 to 52 hours. More than half (52.5%) answered that they lacked sufficient rest.
Women spent 1.85 times more time on household chores than men. Out of an average of 1 hour and 22.97 minutes per day, men spent 58.46 minutes, and women spent 1 hour and 48.79 minutes. There was also a gender difference in caregiving. The average was 50.77 minutes, with men spending 33.88 minutes and women 1 hour and 18.58 minutes.
The research team analyzed, "For households with one child, weekday caregiving time was 1 hour and 40.1 minutes, which was longer than the 1 hour and 26.48 minutes for households with two or more children. This suggests that households with one child likely have younger children, requiring more caregiving time."
© The Asia Business Daily(www.asiae.co.kr). All rights reserved.
![Clutching a Stolen Dior Bag, Saying "I Hate Being Poor but Real"... The Grotesque Con of a "Human Knockoff" [Slate]](https://cwcontent.asiae.co.kr/asiaresize/183/2026021902243444107_1771435474.jpg)


