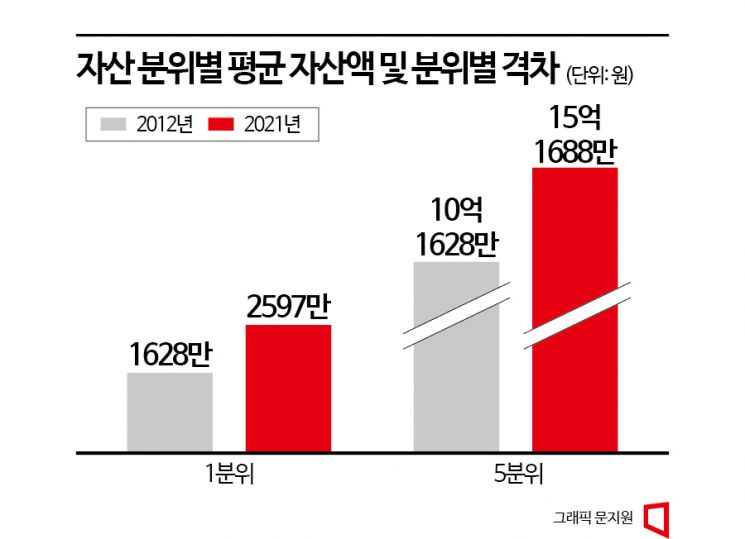
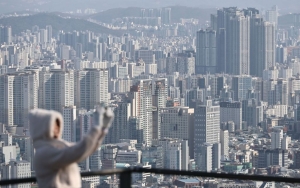
Over the past decade, the assets of the top 20% income group increased by an average of 500 million KRW, while those of the bottom 20% increased by only 10 million KRW. It is analyzed that the rise in real estate prices, which constitute the majority of assets, has caused this 'asset polarization.'

"Top 20% assets grew by 500 million KRW in 10 years... Bottom 20% only 10 million KRW"
According to the February issue of the Health and Welfare Forum by the Korea Institute for Health and Social Affairs, titled 'Income and Asset Polarization and the Reality of Gaps and Policy Implications,' the assets of the 5th quintile (top 20%) increased from 1,016.28 million KRW in 2012 to 1,520 million KRW in 2021, growing by about 500 million KRW over 10 years. In contrast, the assets of the 1st quintile (bottom 20%) rose from 16.28 million KRW to 26 million KRW during the same period, an increase of just over 10 million KRW. Although the asset growth rate was higher for the bottom group (62%) than the top group (50%), the asset gap was as large as 58 times.
"Most assets of the 5th quintile are real estate... 1st quintile mainly financial income"
The report analyzed that "most assets of the 1st quintile (bottom 20%) consist of financial assets, whereas for the 5th quintile (top 20%), real estate accounts for a significant portion of their assets." Low-income groups cannot significantly increase their assets unless they engage in additional income-generating activities, but high-income groups see their assets rise alongside real estate prices.
In 2021, financial assets accounted for 74.3% of the bottom 20%'s assets, with owner-occupied housing making up 13.0%. In contrast, the top 20% had owner-occupied housing as the largest share at 43.2%, followed by other real estate excluding owner-occupied housing (36.0%) and financial assets (17.6%), showing a balanced distribution of asset types. The higher the net asset class, the larger the share of total net assets. For example, the top 1% held 10% of the total, the top 5% held 30%, and the top 10% held 43%. The average net assets of the top 1% were 4.51 billion KRW, which is 2.5 times higher than the top 10% average of 1.79 billion KRW.
"Asset polarization intensified with rapid real estate price surge since 2017"
Looking at inequality indicators, asset polarization deepened again after 2017. The total asset Gini coefficient decreased from 0.593 in 2012 to 0.554 in 2017 but then showed an increasing trend, reaching 0.569 in 2021. The Gini coefficient measures inequality between classes on a scale from 0 to 1, where 1 indicates 'complete inequality.' The Polarization Index by Foster and Wolfson hit a low of 0.545 in 2017 and has risen annually, reaching 0.613 in 2021. The Polarization Index indicates the extent to which the middle class disappears and society splits into lower and upper classes.
It can be interpreted that asset gaps widened due to rising real estate prices during the Moon Jae-in administration. Joo-mi Lee, a senior researcher at the Poverty and Inequality Research Division of the Korea Institute for Health and Social Affairs who authored the report, stated, "Income polarization is being alleviated through cash support such as the Basic Livelihood Security Program, public assistance, and various allowances," but added, "Asset polarization is ongoing, so while continuing housing supply for actual demanders and vulnerable housing groups, policies to stabilize the housing market that can reduce speculative demand should be established."
© The Asia Business Daily(www.asiae.co.kr). All rights reserved.
![Clutching a Stolen Dior Bag, Saying "I Hate Being Poor but Real"... The Grotesque Con of a "Human Knockoff" [Slate]](https://cwcontent.asiae.co.kr/asiaresize/183/2026021902243444107_1771435474.jpg)


