According to KB Real Estate, apartment sales prices in Seoul this month recorded the highest rate of increase so far this year, based on data up to the announcement of the October 15 real estate measures.
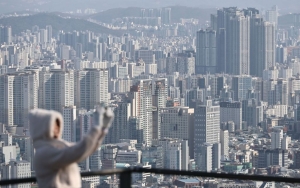
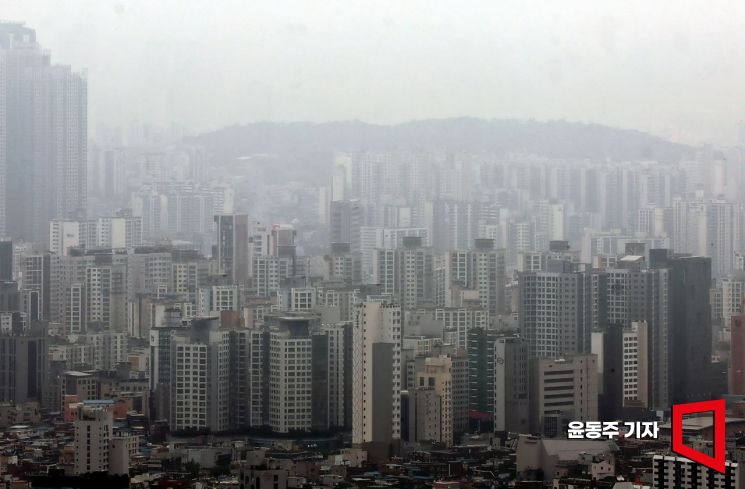 On the 27th, apartment prices in Mapo and Seongdong districts of Seoul were announced to have risen at the largest rate since related statistics began to be published in 2013. The expectation that Seoul apartment prices will continue to rise is projected to sustain the upward trend for the time being. The photo shows a panoramic view of apartment complexes in downtown Seoul as seen from Namsan, Seoul. 2025.06.27 Photo by Dongju Yoon
According to the October housing price trend released by KB Real Estate on the 26th, apartment sales prices in Seoul rose by 1.46% compared to the previous month, marking the 17th consecutive month of increases. The rate of increase expanded by 0.64 percentage points from the previous month’s 0.82%. This is the highest growth rate of the year.
This survey is based on data as of October 13, before the announcement of the October 15 measures that designated all of Seoul and 12 areas in Gyeonggi Province as regulated areas (adjustment target areas and speculative zones) and land transaction permit zones.
As a result, apartment prices surged significantly in autonomous districts within the Hangang Belt that had not previously been included in land transaction permit zones, making gap investment (purchasing homes with existing jeonse tenants) possible.
The areas with the highest increases were Gwangjin District (4.46%), Gangdong District (4.17%), Seongdong District (3.95%), Mapo District (2.96%), Songpa District (2.68%), Dongjak District (2.16%), and Yeongdeungpo District (1.79%), in that order.
Gwangjin District recorded its second-highest rate of increase since November 2006, when it saw a 6.10% rise. Gangdong, Seongdong, and Mapo Districts posted their highest increases since September 2018, when the rate was 3%.
The Seoul metropolitan area (0.60%) and Gyeonggi Province (0.31%) both saw increases, while Incheon (-0.04%) shifted to a decline.
Among the areas newly designated as regulated or land transaction permit zones by the October 15 measures, the following districts in Gyeonggi Province showed notable increases: Bundang District in Seongnam City (4.10%), Gwacheon City (2.83%), Sujeong District in Seongnam City (1.81%), Hanam City (1.47%), Gwangmyeong City (1.32%), Dongan District in Anyang City (1.25%), Jungwon District in Seongnam City (1.14%), and Suji District in Yongin City (1.12%).
Bundang District in Seongnam City recorded its highest increase since September 2018, when the rate was 5.94% during a real estate market upswing.
Nationwide, apartment sales prices rose by 0.28%, marking the seventh consecutive month of increases.
The quintile ratio, which indicates the price gap between the average of the top 20% (fifth quintile) and the bottom 20% (first quintile) of apartments, also set new records every month.
This month, the national average price for the top 20% of apartments was 1.43613 billion won, with the quintile ratio reaching 12.5-an all-time high for the eighth consecutive month. The average price for the top 20% of apartments in Seoul exceeded 3.34409 billion won. In contrast, the average for the bottom 20% was 495.36 million won, with a quintile ratio of 6.8, also setting a new record.
Nationwide apartment jeonse (long-term lease) prices rose by 0.15% from the previous month, marking the eighth consecutive month of increases.
The Seoul metropolitan area (0.22%) saw its 27th consecutive month of increases, and Seoul itself rose by 0.43%, also maintaining an upward trend for 27 consecutive months.
© The Asia Business Daily(www.asiae.co.kr). All rights reserved.
![Clutching a Stolen Dior Bag, Saying "I Hate Being Poor but Real"... The Grotesque Con of a "Human Knockoff" [Slate]](https://cwcontent.asiae.co.kr/asiaresize/183/2026021902243444107_1771435474.jpg)


