Ministry of Land, Infrastructure and Transport Announces April Housing Statistics

From January to April this year, nationwide housing supply indicators remained generally sluggish, while the number of 'persistent unsold units'?homes that remain unsold even after construction is completed?reached its highest level in 11 years and 8 months.
According to the "April Housing Statistics" released by the Ministry of Land, Infrastructure and Transport on the 30th, the number of unsold housing units after completion nationwide stood at 26,422 at the end of last month, up 5.2% (1,305 units) from the previous month. This is the highest figure since August 2013.
Persistent unsold units have increased for 20 consecutive months since August 2023. Of these, 83% (21,897 units) were located in non-metropolitan regions. Daegu had the highest number with 3,776 units, followed by North Gyeongsang (3,308 units), South Gyeongsang (3,176 units), and Busan (2,462 units). Most of the newly added persistent unsold units in April also came from Daegu (524 units) and North Gyeongsang (593 units).
However, the number of general unsold units is decreasing. As of April, the total number of unsold housing units nationwide was 67,793, a 1.6% decrease from the previous month. Both the Seoul metropolitan area (-3.8%) and non-metropolitan regions (-1.0%) saw declines. After peaking at 72,624 units in January this year, the figure has declined for three consecutive months.
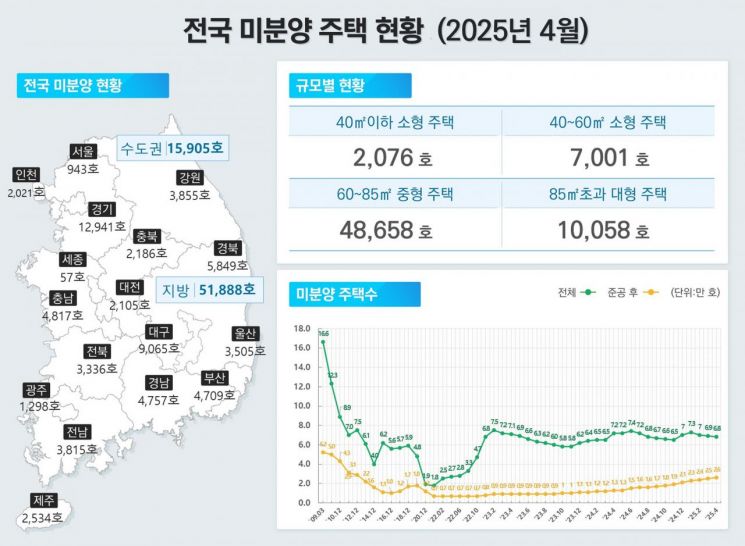 Housing units remaining unsold nationwide from January to April this year. Provided by the Ministry of Land, Infrastructure and Transport
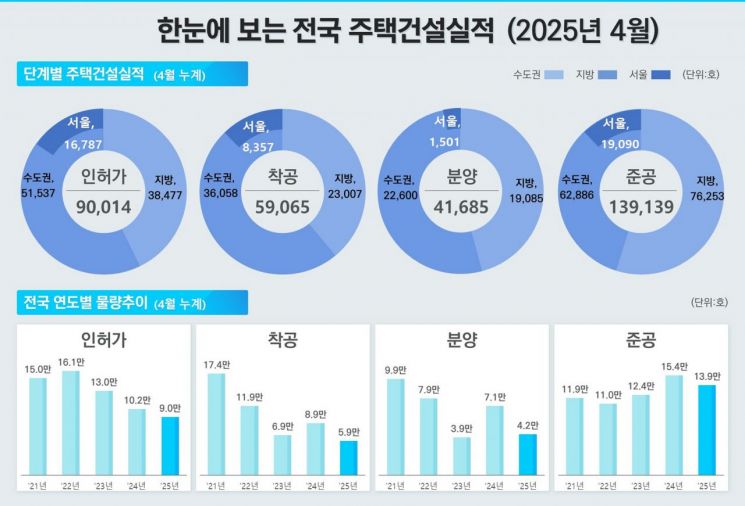
Key Housing Supply Indicators?Permits, Groundbreakings, and Completions?All Flash Warning Signs
Key indicators of housing supply?permits, groundbreakings, and completions?have all contracted. In April, housing permits totaled 24,026 units, a 22.6% decrease compared to the same month last year. The decline was particularly steep in non-metropolitan regions, where permits fell by 38.5%, compared to a 5.8% decrease in the Seoul metropolitan area. For the cumulative period from January to April, permits reached 90,014 units, down 12.2% from the previous year.
Groundbreakings in April alone totaled 20,544 units, an 81.8% increase from the previous month. However, on a cumulative basis from January to April, groundbreakings amounted to 59,065 units, a 33.8% decrease from the previous year.
The situation is similar for pre-sales. In April, 20,214 units were pre-sold, a sharp 133.8% increase from the previous month. However, the cumulative figure since the start of the year was 41,685 units, a 41.0% decrease from last year. Within this, the Seoul metropolitan area saw a 21.7% decrease, while non-metropolitan regions experienced a 54.3% drop.
Housing completions in April totaled 35,107 units, a 34.4% increase from the previous month. However, on a cumulative basis, completions reached 139,139 units, a 9.8% decrease compared to the same period last year. Of this, apartment completions fell by 7.1%, while non-apartment completions dropped by 34.3%.
The government’s "8·8 Supply Plan" last year temporarily boosted public housing supply, leading to a brief recovery, but the trend has reversed again this year. In fact, in 2023, groundbreakings (26%) and completions (3.2%) increased, except for permits (-0.1%), but this year all three indicators have declined.
Housing Sales Market Also Slows... Nationwide and Seoul Transaction Volumes Decline Together
On the demand side, the imbalance is intensifying. In April, nationwide housing sales totaled 65,421 transactions, a 2.7% decrease from the previous month. In Seoul, transactions fell from 12,854 to 12,017 during the same period, a 6.5% decrease. However, compared to January (5,307 transactions), the figure is still more than double. Notably, apartment transactions totaled 8,029, a 14.1% decrease from the previous month.
Apartment transactions in Seoul surged to 9,349 in March due to the lifting of land transaction permit zones, but dropped to the 8,000 range in April following the re-designation of permit zones. In January, transactions were in the 3,000 range, and in February, in the 4,000 range.
The rental market also slowed. In April, the number of monthly and yearly rental transactions was 228,531, down 4.4% from the previous month and 6.9% from the same period last year. For the cumulative period from January to April this year, the proportion of monthly rentals was 60.4%, up 2.4 percentage points from the previous year. In particular, the proportion of monthly rentals for non-apartment housing was 74.8% nationwide and a striking 81.9% in non-metropolitan regions.
© The Asia Business Daily(www.asiae.co.kr). All rights reserved.


