Payment Card Usage Averages 3.4 Trillion KRW Per Day, Up 4.1%
Growth Slows as Private Consumption Decelerates
Non-Face-to-Face Payments and Mobile Device Usage Continue to Expand
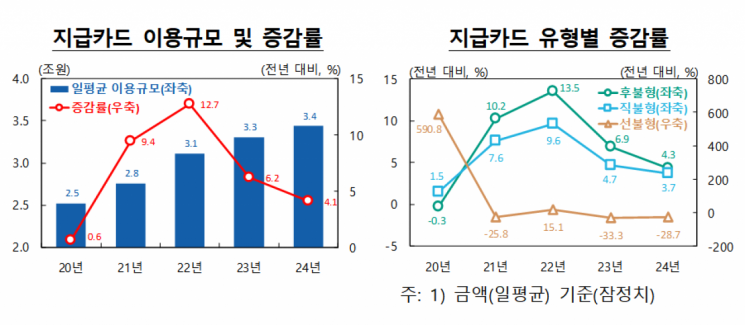
Last year, the daily average usage of payment cards reached 3.4 trillion KRW. Although this was a 4.1% increase compared to the previous year, the growth rate slowed down. This reflects the deceleration in private consumption growth.
According to the "2024 Domestic Payment and Settlement Trends" report released by the Bank of Korea on the 26th, the daily average usage of payment cards last year was 3.4 trillion KRW, up 4.1% from 3.3 trillion KRW the previous year. However, the growth rate declined compared to 2022 (12.7%) and 2023 (6.2%), when consumption recovered as COVID-19 fears subsided. This trend aligns with the slowdown in private consumption growth. The private consumption growth rate gradually decreased from 8.8% in 2022 to 5.1% in 2023, and 3.2% (provisional) last year.
Postpaid and debit cards were used daily on average at 2.7 trillion KRW and 700 billion KRW respectively last year, marking increases of 4.3% and 3.7% compared to the previous year. Prepaid cards (-28.7%) continued to decline due to factors such as the termination of some card companies' regional gift certificate programs. The Seoul Love Gift Certificate sales agency changed from a credit card company (Shinhan Card) to an electronic financial business operator in April last year.
Payment share using mobile devices and others at 52.4%... Easy payments on the rise
Among these, analyzing usage by payment type based on personal and corporate credit·check card (domestic merchants) usage of specialized card companies, the daily average usage last year was about 3 trillion KRW (provisional).
The daily average usage of non-face-to-face payments was 1.2 trillion KRW, up 4.1% from the previous year, while face-to-face payments remained steady at 1.8 trillion KRW daily. Non-face-to-face payments include not only online shopping via smartphones and PCs but also automatic payments through taxi-hailing applications and other mobile device transactions conducted without terminal contact at the point of sale. The share of non-face-to-face payments in total usage (40.8%) slightly increased from 39.9% the previous year.
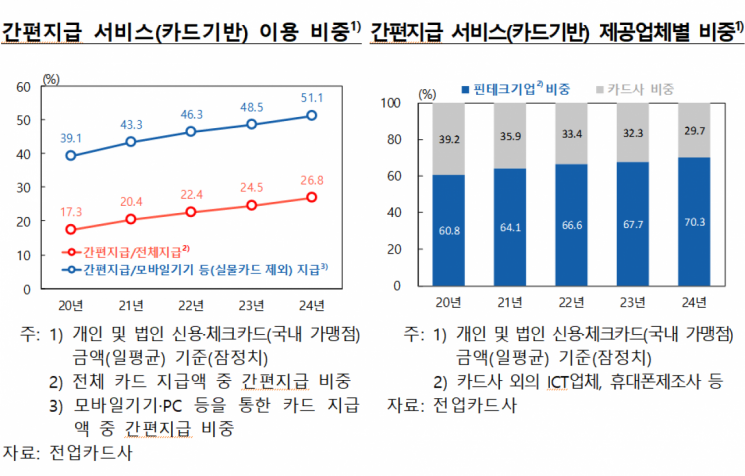
By access device, payments using mobile devices, including PCs, ARS, and biometric authentication (excluding physical cards), amounted to 1.6 trillion KRW daily, a 5.5% increase from the previous year, while payments using physical cards decreased by 2.3% to 1.4 trillion KRW daily. The share of payments using mobile devices in total usage was 52.4%. The share of mobile device usage surpassed physical cards in 2023 and further widened the gap last year.
By authentication method, among payments using mobile devices (excluding physical cards) totaling 1.6 trillion KRW daily, the share of easy payment services (card-based) was 51.1%, continuously expanding due to high convenience.
Among easy payment services, the share of services provided by fintech companies such as ICT firms and mobile phone manufacturers expanded to 70.3%, while the share of card companies decreased to 29.7%.
Public offering subscription activation... Electronic bill issuance and increased use of micropayment networks
Last year, the daily average usage of bills and checks was 16 trillion KRW, up 2.7% from 15.6 trillion KRW the previous year. Demand drafts (-16.6%) decreased for both fixed and non-fixed amounts compared to the previous year. Bills increased by 4.2% year-on-year due to a rise in electronic bill issuance related to public offering subscriptions.
Last year, the daily average amount of account transfers through micropayment networks was 99.2 trillion KRW, a 7.0% increase from 92.7 trillion KRW the previous year. The daily average amount of account transfers using the electronic financial joint network (90.4 trillion KRW) grew mainly due to internet banking (10.3%) and firm banking (9.7%), a corporate financial transaction system handling payroll and payment settlements. The CD joint network (-14.4%) continued to decline. The daily average amount of account transfers via the open banking joint network steadily increased to 2 trillion KRW.
With the activation of public offering subscriptions last year, electronic bill issuance and micropayment network usage increased significantly. The subscription deposit amount for public offerings rose sharply from 314.2 trillion KRW in 2023 to 418.8 trillion KRW last year. On the subscription closing day, the lead financial investment company deposits the subscription deposit with Korea Securities Finance by borrowing the funds through electronic bill issuance in front of Korea Securities Finance, leading to an increase in electronic bill issuance by financial investment companies during public offering subscriptions. The amount of fund transfers through micropayment systems also increased. Funds inflow during public offering subscriptions mainly occurs via internet banking within the electronic financial joint network, while refunds are processed through firm banking and other channels.
Meanwhile, last year, the daily average number of internet banking transactions (including mobile banking) at domestic banks was 25.51 million, with a transaction amount of 87.2 trillion KRW. These figures represent increases of 12.6% and 6.3%, respectively, compared to the previous year. This includes both interbank and intrabank transfers at domestic banks. Mutual savings banks and institutions serving low-income groups were excluded from the survey.
The daily average number of mobile banking transactions (22.67 million) and transaction amount (16.9 trillion KRW) increased by 14.2% and 10.9%, respectively, compared to the previous year. The share of mobile banking in total internet banking usage was about 88.9% in transaction count and 19.4% in transaction amount. The number of non-face-to-face loan application services via the internet (37,000 cases) and the transaction amount (800 billion KRW) decreased by 7.5% and 31.7%, respectively, compared to the previous year.
© The Asia Business Daily(www.asiae.co.kr). All rights reserved.
![Clutching a Stolen Dior Bag, Saying "I Hate Being Poor but Real"... The Grotesque Con of a "Human Knockoff" [Slate]](https://cwcontent.asiae.co.kr/asiaresize/183/2026021902243444107_1771435474.jpg)


