Economic Pain Index, 100% Prediction Accuracy Since 1980
With the U.S. presidential election just over two months away, the market is busy searching for indicators to predict the next occupant of the White House. From various polls to the stock market, Bitcoin, and betting platforms, which election prediction indicator boasts the highest accuracy?
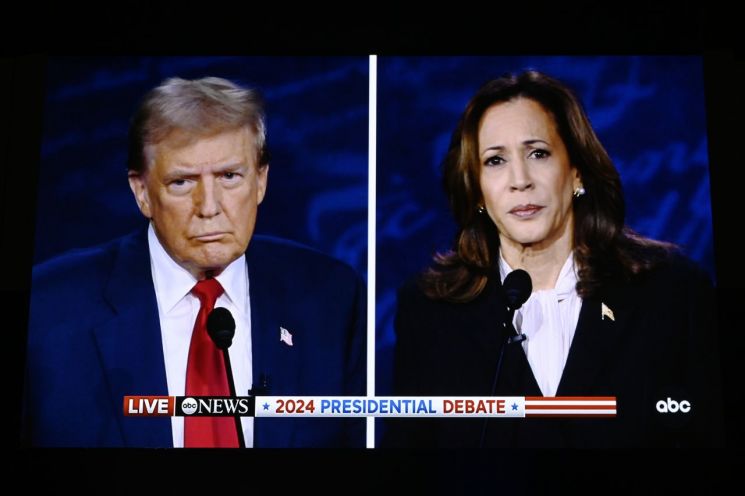
The first TV debate between the Republican presidential candidate, former President Donald Trump, and the Democratic candidate, Vice President Kamala Harris, ended with Harris being declared the 'clear winner,' drawing attention to shifts in polling dynamics. According to a New York Times (NYT) poll on the 11th (local time), Vice President Harris leads former President Trump with 49% support to 47%. On Polymarket, the world's largest betting platform with about $885 million in cryptocurrency funds, the winning probabilities for both candidates stand evenly at 49% each.
However, the U.S. economic magazine Fortune recommends looking at the stock market rather than polls if you want to know who will occupy the next White House. Historically, the accuracy of polls has not been as high as expected. In fact, last year, Nathaniel Rakich, senior election analyst at the statistics platform FiveThirtyEight, analyzed hundreds of U.S. election polls from 1998 to 2022 and found that polls correctly predicted the winner only 78% of the time.
In contrast, the performance of the S&P 500 index between August and October has accurately predicted the winner of every presidential election since 1984. In years when the S&P 500 rose during this period, the incumbent party's candidate won, while in years when it fell, the opposition candidate took power. Regarding this, John Lynch, Chief Investment Officer (CIO) at Comerica Bank, explained, "Stock performance reflects broad economic sentiment. If voters are satisfied with the economic direction, they tend to support the status quo; if dissatisfied, they are more likely to vote for change."
However, experts point out that this indicator does not guarantee 100% accuracy every time. For example, during the 1976 and 1980 elections, the S&P 500 rose by 14.1% and 13.4%, respectively, but due to severe inflation, both elections ended with the incumbent party losing.
Fortune also highlighted another noteworthy election result indicator: the "misery index." The misery index is the sum of the annual U.S. inflation rate and the unemployment rate, serving as a gauge of voters' economic dissatisfaction. Fortune emphasized, "The three-month moving average of the misery index between August and October has accurately predicted every presidential election result since 1980. When this index decreases, the incumbent party wins; when it increases, they lose."
As of August, the U.S. misery index stood at 6.73%, slightly down from 7.19% in July. This is about half the peak of 12.66% recorded by the Joe Biden administration in July 2022. Lynch, the CIO, analyzed, "If this rule holds for this election, the Democrats will have about a 15 basis point (1bp = 0.01 percentage point) cushion until October. However, the unexpected rise in the July unemployment rate could pose a potential threat to Harris's presidential bid." Previously, the U.S. unemployment rate in July was recorded at 4.3%, the highest level in two years and nine months since October 2021.
© The Asia Business Daily(www.asiae.co.kr). All rights reserved.
![Clutching a Stolen Dior Bag, Saying "I Hate Being Poor but Real"... The Grotesque Con of a "Human Knockoff" [Slate]](https://cwcontent.asiae.co.kr/asiaresize/183/2026021902243444107_1771435474.jpg)


