Improvement of Perceived Video Quality and User Satisfaction
Volume Levels Meet Standards
[Asia Economy Reporter Lim Hye-seon] LG Uplus ranked first in last year's paid broadcasting user satisfaction evaluation. LG Uplus received the highest scores in 'user satisfaction by service stage' and 'content' categories, and also had the fastest 'channel switching time.' SK Broadband had the fastest set-top box startup time.
The Ministry of Science and ICT and the National Information Society Agency conducted a paid broadcasting service quality evaluation and released the results on the 18th. The two organizations annually evaluate quantitative items such as video perceived quality and volume level, as well as qualitative items such as user satisfaction by service stage, targeting paid broadcasting services provided by a total of 18 paid broadcasting operators. This is to provide objective quality information on paid broadcasting services and to create a competitive environment among operators.
Compared to the previous year, video perceived quality and user satisfaction by service stage improved last year, and volume levels met the standards. On the other hand, set-top box startup time and VOD advertising time slightly increased.
The video perceived quality, directly evaluated by user panels in each household, scored an overall average of 4.55 points (on a 5-point scale), which was generally rated as excellent. This was a slight improvement from the previous year (4.47 points). The frequency of abnormal screen occurrences such as freezing or distortion was on average 0.16 times per episode, meaning about 16 times experienced over 100 episodes.
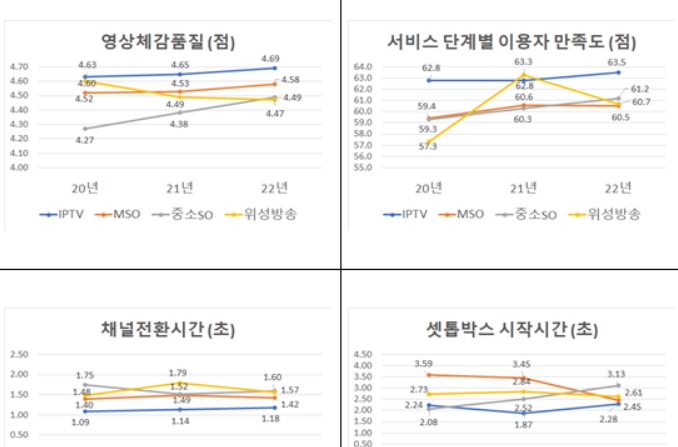
The survey on user satisfaction by paid broadcasting service stage showed an overall average of 61.4 points, an improvement from the previous year (61 points). Satisfaction increased or was maintained at the previous year's level for most operator types, but satellite broadcasting saw a decrease. By service stage, satisfaction was relatively high at installation (68 points), A/S (66.4 points), and change (65.7 points) stages. By company, LG Uplus scored the highest at 63.7 points, followed by SK Broadband (63.5 points) and KT (63.4 points).
In the user satisfaction survey on set-top box performance, convenience of the UI and ease of device interconnection scored relatively high, while response speed and ease of remote control operation scored lower. Content satisfaction is a newly added evaluation item this year. A survey was conducted on user satisfaction regarding the content provision status, including the diversity of provided VOD and the appropriateness of paid VOD costs. The average score by indicator was 57 points. In particular, IPTV showed high satisfaction in all categories such as genre diversity, number of videos, preferred content, latest VOD, and diversity of additional content.
As a result of measuring the average volume level of real-time broadcast channels and the average volume difference between channels, all operators met the standard volume criterion (-24 LKFS). The newly measured standard volume exceedance rate this year averaged 8.10%, meaning that out of 100 measurements, 8 times exceeded the standard. Meanwhile, the maximum volume difference between individual channels averaged 7.91 dB.
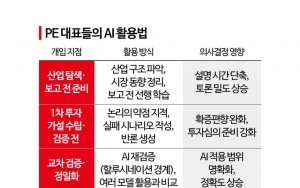
The overall average channel switching time measured by various channel types such as adjacent/non-adjacent channels and resolution-based channels was 1.48 seconds, similar to the previous year (1.46 seconds). The difference between minimum and maximum times varied by operator type, showing about 2 to 4 seconds, with satellite broadcasting at 3.97 seconds and small/mid-sized SO at 2.18 seconds, indicating some variation.
The set-top box startup time, measured as the time from turning on the set-top box in standby mode to the point when service use is possible, averaged 2.77 seconds, an increase of 0.08 seconds from the previous year (2.69 seconds). This increase in startup time is presumed to be due to the various additional services equipped in IPTV. The newly measured difference between minimum and maximum startup times this year averaged 2.11 seconds (1.92 to 4.03 seconds). User subjective satisfaction with set-top box startup time averaged 56.3 points.
The average number of ads per paid VOD was 0.45 times, and ad time was 11.24 seconds, showing a slight decrease in ad frequency compared to the previous year (0.5 times, 11.10 seconds). On the other hand, ad time slightly increased. For free VOD ads, measured for the first time this year, the average number of ads was 2.11 times, and ad time was 66.26 seconds, about six times the ad time of paid VOD. KT had the highest number of ads and longest ad times for both paid and free VOD.
© The Asia Business Daily(www.asiae.co.kr). All rights reserved.
![Clutching a Stolen Dior Bag, Saying "I Hate Being Poor but Real"... The Grotesque Con of a "Human Knockoff" [Slate]](https://cwcontent.asiae.co.kr/asiaresize/183/2026021902243444107_1771435474.jpg)


