US Manufacturing Index Below 50 Signals Economic Contraction
Central Bank Monetary Policy Changes
Debt Investment Indicator
Declining Stock Credit Balance Suggests Market Bottom
Stock Market Stimulus
Full Ban on Short Selling Could Mark True Bottom
!["To Enter or Not?... 3 Signals Confirming the 'Stock Market Bottom' [Practical Investment]"](https://cphoto.asiae.co.kr/listimglink/1/2022062216552623374_1655884526.jpg)
[Asia Economy Reporter Ji Yeon-jin] "Buy the fear, sell the greed."
This is the time when the famous investment adage of 'investment genius' Warren Buffett is being circulated. The KOSPI index soared to an all-time high of 3,316.08 during trading on June 25 last year, but has fallen to the 2,300 level this month. It has dropped about 1,000 points (30%) in one year, signaling 'fear.' The US monetary tightening that has troubled the stock market over the past year is just beginning. The US Federal Reserve (Fed) implemented a 'giant step' by raising the benchmark interest rate by 75 basis points this month. Some predict that the Fed could raise the benchmark interest rate to 4-7% within the year. Separately, the Fed also began quantitative tightening this month by purchasing bonds worth $45 billion (about 58 trillion won) monthly. This suggests the stock market could slide further. However, it is said that it is darkest before the dawn. Let's look at indicators signaling the market bottom and use them as signals for a rebound.
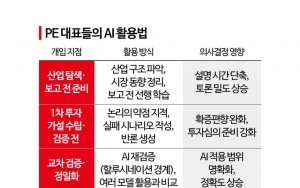
◆ "US Manufacturing Index (IMS) below 50 is a buying opportunity" = There is a US Manufacturing Index (IMS) published monthly by the Institute for Supply Management (ISM). It is calculated based on monthly surveys of over 400 companies across 20 industries in the US. An index above 50 indicates economic expansion, while below 50 signals contraction, serving as a leading economic indicator.
!["To Enter or Not?... 3 Signals Confirming the 'Stock Market Bottom' [Practical Investment]"](https://cphoto.asiae.co.kr/listimglink/1/2022062310273824129_1655947658.jpg)
According to KB Securities' analysis of the IMS index and KOSPI trends, past bear market bottoms were formed when the ISM index was below 50. Typically, stock price bottoms appeared about 1-2 months before the IMS index bottomed, and the first bottom was formed when the central bank changed its monetary policy stance after the IMS index fell below 50. Then, when the economy reached its lowest point, a second bottom often appeared in the form of a 'double bottom.' After the 2008 global financial crisis, the IMS index fell below 50 in the third quarter of 2012 (Southern European debt crisis), fourth quarter of 2015 (oil-producing countries and China-related crisis), and third quarter of 2019 (trade war and repo market shock). In all cases, vulnerabilities were exposed as the IMS index approached 50, prompting central banks to change monetary policy.
However, since 1960, the only case where tightening was not stopped when the IMS index was below 50 was in 1979, when US inflation reached 14.8%. KB Securities researcher Lee Eun-taek said, "Even during times when inflation hovered around 10%, when the ISM manufacturing index fell below 50, the Fed shifted its monetary policy from inflation control (tightening) to economic defense (easing)." He added, "It is unlikely to be much different this time." He also said, "Given the current high inflationary pressure, the Fed is unlikely to stop tightening while the ISM manufacturing index is above 50. Currently, the ISM index is 56.1, and it will take at least 1-2 quarters to fall below 50."
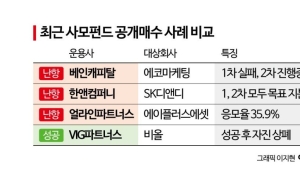
◆ Check the 'debt investment' indicator = The credit balance, which refers to the amount of stocks purchased on margin by individual investors through securities firms and that must be repaid, is also used as an indicator to gauge the market bottom. During a rising market, investors typically increase margin loans to maximize profits. Conversely, in a falling market, margin trading can lead to forced liquidation, accelerating the decline.
!["To Enter or Not?... 3 Signals Confirming the 'Stock Market Bottom' [Practical Investment]"](https://cphoto.asiae.co.kr/listimglink/1/2022062310275924130_1655947679.jpg)
In fact, the credit balance fell from around 10 trillion won in January 2020 to the mid-6 trillion won range during the COVID-19 crash, then began to increase, exceeding 25 trillion won in August last year. Since then, the credit balance has declined amid a sideways market and dropped to 20 trillion won this month.
According to Shinhan Investment Corp.'s analysis, historical stock market bottoms generally coincided with the bottom of the 'credit balance ratio,' which is the credit balance as a proportion of the KOSPI market capitalization. During the trade dispute and COVID-19 pandemic, the credit balance ratio decreased by about 30% from its peak. This year, during the downtrend, it decreased by 10%. Shinhan Investment researcher Choi Yoo-jun said, "The credit loan balance ratio strongly depends on stock prices. If there is room for further price declines, additional selling pressure may act. Assuming the credit loan balance ratio decreases by 30% from its peak and applying the current market capitalization, the KOSPI credit balance could decrease by about 2.4 trillion won further."
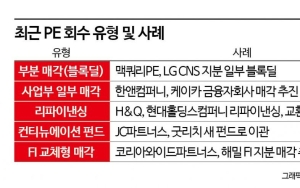
◆ The true bottom comes when the government announces stock market support measures = During the COVID-19 crash on March 23, 2020, the KOSPI hit a bottom at 1,482.46. Earlier, on March 17, the government imposed a six-month full ban on short selling. The short selling volume ratio to total trading volume was close to 10%, but after the policy was implemented, short selling disappeared. During this period, the KOSPI index steadily rebounded and rose to an all-time high last year. After the European debt crisis, a short selling ban was implemented on August 10, 2011, and the KOSPI bottomed a month later. Hana Financial Investment researcher Lee Kyung-soo said, "During periods of increased index volatility and weak supply-demand fundamentals, a surge in short selling can cause further index declines. Among index stabilization policies, the short selling ban played a very decisive role in stabilizing the index bottom." He added, "In the current inflation concern market, the timing of the index bottom can be gauged by whether active policies such as short selling bans are implemented."
© The Asia Business Daily(www.asiae.co.kr). All rights reserved.
![Clutching a Stolen Dior Bag, Saying "I Hate Being Poor but Real"... The Grotesque Con of a "Human Knockoff" [Slate]](https://cwcontent.asiae.co.kr/asiaresize/183/2026021902243444107_1771435474.jpg)


