Bank of Korea '2020 National Balance Sheet (Provisional)'
[Asia Economy Reporter Kim Eunbyeol] Following the COVID-19 pandemic last year, real estate and stock prices surged, increasing the nation's net assets by approximately 1,094 trillion KRW. Net assets per household (net financial assets + non-financial assets) rose by nearly 11%.
National Net Assets Increase by 1,094 Trillion KRW... Net Assets per Household 510 Million KRW, Up 11%
According to the '2020 National Balance Sheet (Provisional)' released on the 22nd by the Bank of Korea and Statistics Korea, the nation's net assets increased by 1,093.9 trillion KRW during 2020, totaling 1,772.22 trillion KRW. While non-financial assets rose by 1,186.3 trillion KRW, financial liabilities (2,031.3 trillion KRW) increased more than financial assets (1,938.9 trillion KRW), resulting in a decrease of 92.4 trillion KRW in net financial assets.
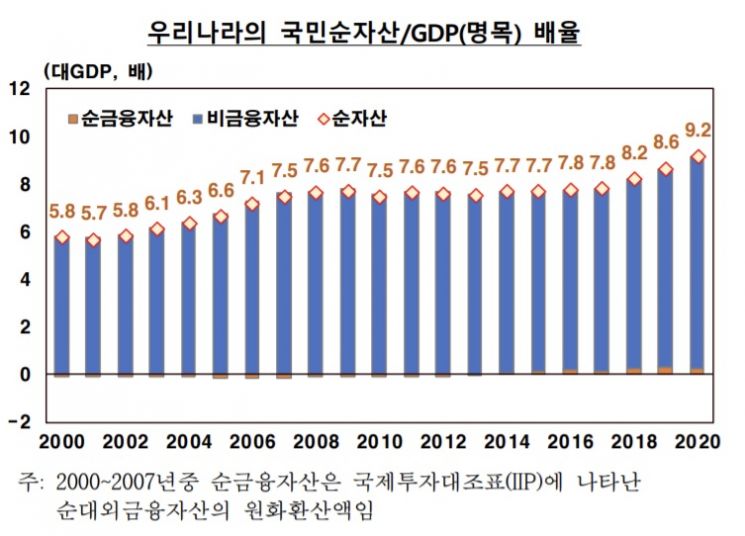
The nation's net assets recorded 9.2 times the nominal Gross Domestic Product (GDP), higher than the previous year's 8.6 times. Although net external financial assets slightly decreased, non-productive assets, mainly land assets, increased.
South Korea's net external financial assets, calculated by subtracting external financial liabilities from external financial assets, stood at 466.1 billion USD last year, down from 517.8 billion USD the previous year. The Bank of Korea stated, "Despite an increase in external financial assets due to expanded overseas securities investments, external financial liabilities increased more significantly due to domestic stock price rises, resulting in a 51.7 billion USD decrease compared to the end of the previous year."
As of the end of last year, net assets per household were estimated at 512.2 million KRW, 10.6% higher than the 462.97 million KRW at the end of 2019. This is estimated to be the highest growth rate on record. Since the national balance sheet statistics do not separately estimate the household sector, this estimated net asset amount per household is calculated by dividing the total net assets of 'households and non-profit organizations' (1,042.3 trillion KRW) by the estimated number of households.
Converted at market exchange rates, net assets per household were 434,000 USD, lower than the 2019 figures for the United States (917,000 USD), Australia (803,000 USD), Canada (554,000 USD), France (468,000 USD), and Japan (476,000 USD). However, based on purchasing power parity (PPP) exchange rates (594,000 USD), it exceeded France (572,000 USD) and Japan (500,000 USD).
The net assets of households and non-profit organizations increased by 11.9% (111 trillion KRW) compared to the previous year. This growth rate is not only higher than the 6.8% in 2019 but also the highest ever recorded. In terms of composition, housing accounted for 5,344 trillion KRW, or 42.8%, while real estate other than housing was about 2,419.6 trillion KRW, or 19.4%.
The ratio of net assets and real estate assets of households and non-profit organizations to gross disposable income (PGDI; income households can freely use for consumption and savings) was 9.6 times and 7.2 times, respectively. These figures significantly exceeded the 2019 ratios of 8.8 times and 6.7 times, marking record highs for both statistics.
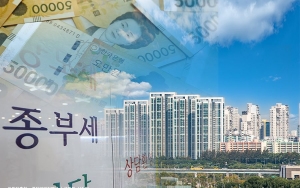
Due to Real Estate Surge... Land Assets Reach Historic High of 5.0 Times GDP
Last year, with real estate prices soaring, the ratio of land assets to GDP reached a historic high of 5.0 times. Real estate, including land and buildings, accounted for 77.0% of non-financial assets. This reflects the continued surge in real estate prices following COVID-19, and it is expected that the share of real estate in national wealth may increase further.
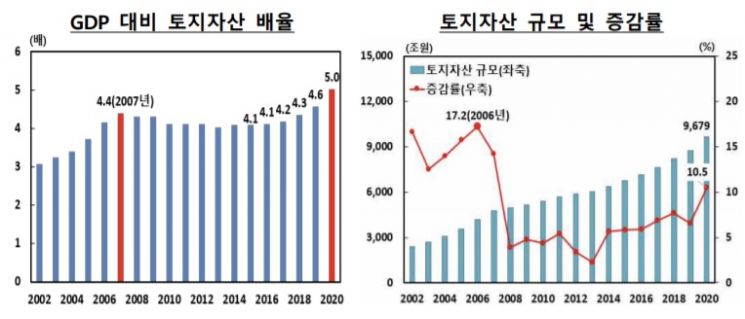
Land assets last year amounted to 9,679.4 trillion KRW, a sharp increase of 917 trillion KRW (10.5%) from the previous year. As of the end of last year, land assets reached about 5.0 times the GDP.
The ratio of land assets to GDP has steadily increased from 4.2 times in 2017 to 4.3 times in 2018, 4.6 times in 2019, and 5.0 times in 2020. This is the highest ratio recorded since related statistics began being compiled.
The Bank of Korea explained, "The increase in land assets was mainly due to growth in residential buildings and land attached to non-residential buildings." While nominal GDP grew by 0.4% last year, land assets surged by more than 10%, raising the ratio relative to GDP.
As of the end of 2019, the regional status of land assets showed that the Seoul metropolitan area accounted for 5,008.9 trillion KRW, or 57.2% of the total. The growth rate compared to the previous year was 7.1%, exceeding the 5.8% growth rate in non-metropolitan areas.
In 2019, the metropolitan area's share expanded from 56.9% to 57.2%, while the non-metropolitan area's share shrank from 43.1% to 42.8% compared to the previous year.
The Bank of Korea noted, "In the 2000s, the growth rate in the metropolitan area was higher than in non-metropolitan areas, but this reversed after 2011. However, since 2018, the metropolitan area has again shown higher growth."
In 2020, real estate (land + buildings) accounted for 77.0% of non-financial assets, reflecting the increase in land. This is an expansion from 76.1% in 2019. Conversely, the share of producer assets excluding buildings was 22.7%, down from 23.6% the previous year.
© The Asia Business Daily(www.asiae.co.kr). All rights reserved.
![Clutching a Stolen Dior Bag, Saying "I Hate Being Poor but Real"... The Grotesque Con of a "Human Knockoff" [Slate]](https://cwcontent.asiae.co.kr/asiaresize/183/2026021902243444107_1771435474.jpg)


