Announcement of 2020 Seoul Welfare Survey Results... Used for Policy Making
33.3% of All Households Are Single-Person Households... Youth 41.2% > Elderly 22.6% > Middle-Aged 16.2%
[Asia Economy Reporter Lim Cheol-young] Single-person households in Seoul account for 33.3% of all households, making them the largest household type. In particular, the proportion of young single-person households reached 41.2%, and elderly single-person households accounted for 22.6%. These single-person households cited "difficulty in emergency response," "loneliness," and "economic insecurity" as major challenges.
On the 29th, Seoul City announced these findings through the results of the "2020 Seoul Welfare Status Survey," which includes the status of single-person households. The survey aims to comprehensively understand the living conditions, welfare usage, welfare demand, and welfare awareness of Seoul citizens. It was conducted over two months starting in November last year, targeting 4,000 households (9,472 household members) in Seoul through face-to-face interviews and other methods.
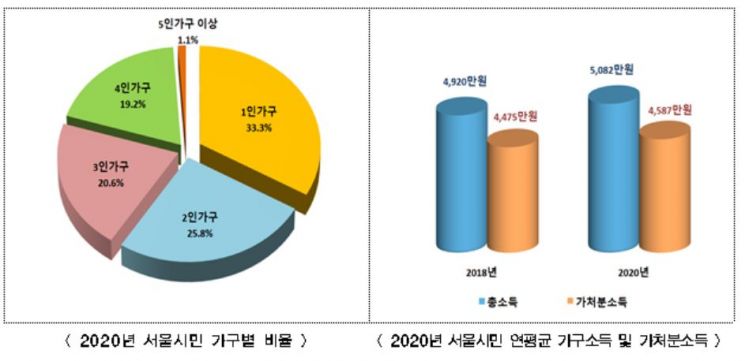
The survey results showed that the proportion of single-person households in Seoul reached 33.3%. The distribution was 33.3% for single-person households, 25.8% for two-person households, 20.6% for three-person households, and 19.2% for four-person households.
The average annual total household income was 50.82 million KRW, a slight increase compared to 2018. The average annual total household income was 50.82 million KRW (median income 44.4 million KRW), disposable income was 45.87 million KRW (median income 39.5 million KRW), and the average asset amount was 513.51 million KRW. In the 2018 welfare status survey, the average annual total household income was 49.2 million KRW, and disposable income was 44.75 million KRW.
Among Seoul households, 44.2% held debt, with an average amount of 99.78 million KRW. The average debt amount for all Seoul households was 44.08 million KRW, and for households with debt, the average debt amount was 99.78 million KRW. The reasons for debt were 43.2% for preparing rental deposits, 38.7% for purchasing residential housing, and 5.0% for investment purposes. By age group, the main reason for debt among households in their 30s and 40s was preparing rental deposits at 58.7%, while for those in their 50s and 60s and those aged 70 and above, housing purchase costs were highest at 53.8% and 48.6%, respectively.
The average housing cost for homeowners in Seoul was 758.57 million KRW, and the average jeonse (key money deposit lease) was 319.29 million KRW. The housing occupancy types were 42.4% owner-occupied, 37.0% jeonse, 18.8% monthly rent with deposit, and 0.9% monthly rent without deposit. Compared to 2018, owner-occupied and monthly rent increased, while the proportion of jeonse decreased. Regarding health perception, 85.1% of Seoul citizens considered themselves healthy, and 18.7% reported feelings of depression. Notably, 4.7% were identified as high-risk groups.
◆ Among single-person households, young households account for 41%... Average desired number of children is 1.48 = Among all single-person households, young households accounted for 41.2%, followed by middle-aged households at 16.2% and elderly households at 22.6%.
The main reasons for living alone were proximity to work or school (48.6%), divorce, separation, or bereavement from a spouse (31.3%), and personal convenience and freedom (10.2%). For young households, 81.5% cited proximity to work or school, while middle-aged and elderly households cited divorce, separation, or bereavement from a spouse at 68.5% and 80.3%, respectively.
The most difficult aspects of living alone were difficulty in emergency response (32.5%), loneliness (23.3%), and economic insecurity (20.3%). Young households prioritized difficulty in emergency response (42.1%), middle-aged households prioritized loneliness (33.1%), and elderly households prioritized economic insecurity (34.3%). Notably, the poverty rate among elderly household heads was 15.2%, higher than the overall household poverty rate of 4.2%. The average monthly income of elderly household heads was 2.86 million KRW, with income composition of 37.5% earned income, 21.4% public transfer income, and 20.2% business income, showing a higher proportion of public transfer income compared to other generations.
Additionally, the average desired number of children was 1.48, while the average current number of children was 1.27. The proportion of households reporting career interruption after childbirth was 11.0%. Reasons for not having as many children as desired included plans to have children in the future (50.9%), economic burden (24.6%), and difficulties with work life (8.9%). Reasons for career interruption after childbirth included lack of trustworthy childcare facilities (33.9%), lack of guaranteed maternity leave or parental leave at work (25.1%), and a personal desire to raise the child directly (18.5%).
The utilization rate of childcare facilities for infants and toddlers (0-5 years old) was 71.9%, and the utilization rates for child and youth welfare programs were 52.9% for after-school programs, 33.0% for elementary school care classrooms, and 4.2% for Our Neighborhood Care Centers. Among households using childcare facilities, the usage rate of public and national daycare centers was 22.5%, an increase from 15.9% in 2018. The willingness to use child and youth welfare programs was 56.9% for after-school programs, 47.1% for elementary school care classrooms, and 38.1% for Our Neighborhood Care Centers, indicating a higher potential demand for Our Neighborhood Care Centers compared to actual usage.
◆ Preferred welfare policies: child care > adult care > housing policy = Respondents evaluated the monthly income necessary to maintain a minimum standard of living in Seoul at 2.96 million KRW. The monthly income needed to maintain a minimum standard of living in Seoul was 2.96 million KRW, appropriate income was 3.66 million KRW, minimum living expenses were 2.45 million KRW, and appropriate living expenses were 3.09 million KRW.
The welfare policies preferred by Seoul citizens were child care and adult care. The preference for policy areas was child care (20.3%), adult care (20.1%), and housing policy (18.5%). The target groups for policies were elderly (19.3%), infants and toddlers (16.0%), and low-income groups (13.8%), indicating an increased demand for support for infants and children compared to the 2018 survey.
When asked about expectations of maintaining basic livelihood through Seoul City support during an economic crisis, 43.3% responded positively. The primary responsibility for welfare as perceived by Seoul citizens was themselves (27.3%), the central government (22.5%), and family and relatives (15.6%).
Seoul City plans to release the "2020 Seoul Welfare Status Survey Basic Analysis Report" in May after detailed analysis of living conditions by target groups and welfare usage by sector. Previously, Seoul City has been operating the dedicated organization ‘Single-Person Household Special Measures Task Force (TF)’ since the 19th to comprehensively and multidimensionally support single-person households.
Kim Seon-soon, Director of Seoul City Welfare Policy Office, said, “The Seoul Welfare Status Survey, conducted every two years, examines the living conditions of Seoul citizens, including economic activity, income and asset levels, housing conditions, and health status, as well as welfare usage by sectors such as single-person households, low-income households, child and infant households, elderly households, and young households. We will use the survey results as basic data to establish policies focused on single-person households that Seoul City plans to promote, thereby improving the quality of life for Seoul citizens.”
© The Asia Business Daily(www.asiae.co.kr). All rights reserved.


