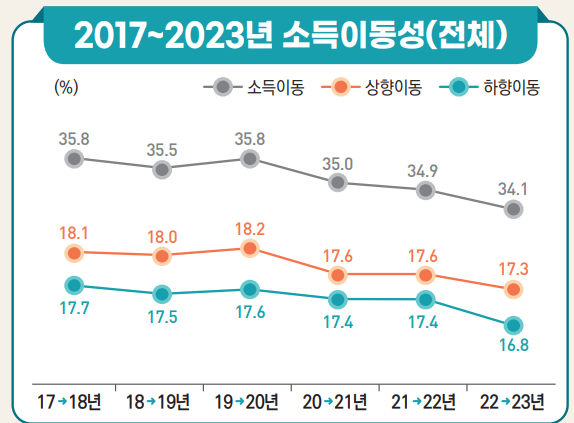
"2023 Income Mobility Statistics" Results
Upward Mobility at 17.3%, Downward Mobility at 16.8%
Only about 2 out of every 10 people experienced an increase in income that allowed them to move up an income bracket during the year. While it remains difficult to enter the top 20% income group (the fifth quintile), once people reach this level, it has become increasingly rare for them to move down. Conversely, it is becoming more difficult for those in the bottom 20% (the first quintile) to escape poverty. Since the COVID-19 pandemic, inequality has not eased, and social mobility has continued to slow for the third consecutive year.
According to the “2023 Income Mobility Statistics” released by the National Data Office on October 27, as of 2023, 34.1% of people experienced a change in income quintile compared to the previous year. This figure represents a 0.8 percentage point decrease from the previous year (34.9%), marking the third consecutive year of declining mobility.
Of these, 17.3% moved up to a higher income quintile, while 16.8% moved down, with the upward mobility rate slightly higher. However, both upward and downward mobility rates declined, indicating an overall weakening of income mobility.
By gender, women had a higher mobility rate at 35.2% compared to men at 33.3%. For women, the upward mobility rate was 18.1%, which is 1.1 percentage points higher than the downward mobility rate (17.1%). For men, both upward and downward mobility rates were the same at 16.6%.
Income mobility by age group was highest among young people and lowest among the elderly. The mobility rate for the youth group (ages 15-39) was 40.4%, followed by the middle-aged group (ages 40-64) at 31.5%, and the elderly (65 and older) at 25.0%. Among young people, upward mobility (23.0%) exceeded downward mobility (17.4%). However, among the middle-aged and elderly, downward mobility was higher by 2.1 percentage points and 5.2 percentage points, respectively.
Choi Paul, Director of the Economic and Social Statistics Research Division at the National Statistical Research Institute, explained, “In 2023, income mobility was higher for women than men and highest among young people, followed by the middle-aged and then the elderly. The middle-aged and elderly experienced higher rates of downward mobility, while the youth had higher upward mobility. This is because the youth are just entering the labor market.”
 Job seekers participating in the 'Gyeonggi-do 5070 Job Fair' held at KINTEX in Goyang, Gyeonggi-do on the 14th are looking at the recruitment board. 2025.10.14 Photo by Kang Jinhyung
Escape Rate from the Bottom Tier at 29.9%... 9 out of 10 in the Top Quintile Remain
It is becoming increasingly difficult for those in the lower income bracket to move up. Of those who were in the bottom 20% (first quintile) in 2022, 70.1% remained in the same bracket in 2023, and only 29.9% moved up to the second quintile or higher. This figure is a 1.0 percentage point decrease from the previous year (30.9%), indicating a decline in upward mobility for the lowest income group.
In contrast, the income retention rate for the top 20% (fifth quintile) remained high at 85.9%, meaning that nearly 9 out of 10 people stayed in the top bracket. Entry into the fifth quintile also proved challenging. Among those in the fourth quintile in 2022, only 10.5% moved up to the fifth quintile in 2023, a lower rate than transitions between other brackets.
The income mobility rate for the second quintile was the highest at 48.6%, followed by the third quintile at 44.0%, the fourth quintile at 34.0%, the first quintile at 29.9%, and the fifth quintile at 14.1%. The income retention rates were highest at the extremes: fifth quintile (85.9%), first quintile (70.1%), fourth quintile (66.0%), third quintile (56.0%), and second quintile (51.4%), indicating a strong tendency for income brackets to become entrenched at both ends of the spectrum.
64.0% Saw Income Rise... 22.3% Had Less Than 10% Increase
In terms of absolute mobility, 64.0% of people saw their income increase in 2023, a 0.4 percentage point decrease from the previous year (64.4%). Meanwhile, the proportion of people whose income decreased rose by 1.0 percentage point to 33.9%.
Breaking down the scale of income increases: 22.3% experienced a rise of less than 10%, 21.3% saw an increase between 10% and 50%, and 20.4% had an increase of 50% or more.
By gender, 64.4% of men saw their income rise and 33.8% saw it fall, while 63.5% of women experienced an increase and 34.1% a decrease. By age group, the youth had the highest rate of income increase at 67.5%, followed by the middle-aged at 63.6%, and the elderly at 52.4%. The elderly also had the highest rate of income decrease at 39.9%.
In 2023, the threshold values for each income quintile (the minimum income required to be classified in each bracket) showed a smaller increase at higher income levels. The threshold for the first quintile decreased by 6.1 percentage points to 12.6% compared to the previous year, the second quintile was 10.0% (down 2.4 percentage points), the third quintile was 8.4% (no change), and the fourth quintile was 6.2% (down 0.8 percentage points). The average income growth rate was 5.8%, a decrease of 1.8 percentage points from the previous year. This indicates that income growth slowed more for the lower income groups, and the gap with the higher income groups did not narrow.
Regional Mobility... Highest in Jeju and Incheon, Lowest in Sejong and North Jeolla
By region, income mobility was highest in Jeju (35.5%), Incheon (35.4%), and Gyeonggi (34.8%). In contrast, Sejong (30.5%), North Jeolla (31.5%), and Gangwon (31.8%) had the lowest mobility rates.
The upward mobility rates were highest in Jeju (17.9%), Incheon (17.8%), and Seoul (17.6%), while the downward mobility rates were highest in Incheon (17.7%), Jeju (17.6%), and Gyeonggi (17.3%). Sejong, Ulsan, and North Jeolla had the lowest downward mobility rates.
The “2023 Income Mobility Statistics” are based on a longitudinal panel analysis of about 11 million people aged 15 or older with earned or business income, using a combination of National Tax Service income data and administrative data. The analysis tracked changes in individual income, movement between income brackets, and the duration individuals remained within each bracket.
© The Asia Business Daily(www.asiae.co.kr). All rights reserved.
![Clutching a Stolen Dior Bag, Saying "I Hate Being Poor but Real"... The Grotesque Con of a "Human Knockoff" [Slate]](https://cwcontent.asiae.co.kr/asiaresize/183/2026021902243444107_1771435474.jpg)


