Per Capita GNI Reaches $36,624 Last Year... Up 1.2% from Previous Year
Remains in the $36,000 Range Due to High Exchange Rate
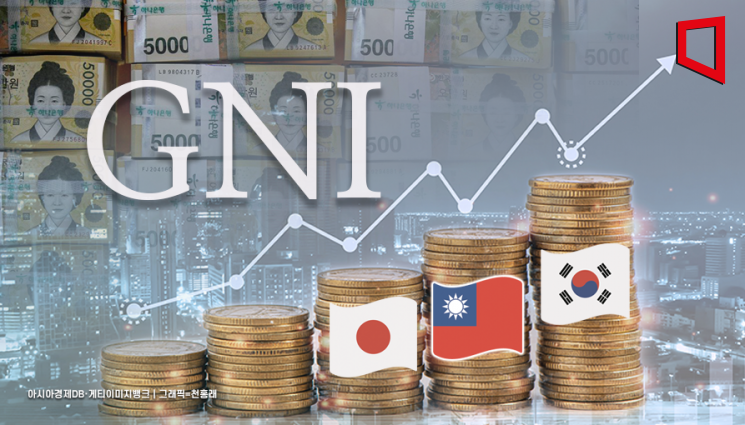
Surpasses Japan and Taiwan in Per Capita Income for Second Consecutive Year
Expected to Maintain 6th Place Globally Among Countries with Over 50 Million Population
Last year, South Korea's per capita Gross National Income (GNI) recorded $36,624. Despite a slight increase compared to 2023 due to the high exchange rate impact, it remained in the $36,000 range, surpassing the per capita GNI of Japan and Taiwan for the second consecutive year. Among countries with populations over 50 million, it ranks sixth globally. The preliminary figures for real Gross Domestic Product (GDP) growth rate in the fourth quarter and for the entire year were 0.1% and 2.0%, respectively, matching the flash estimates announced in January.
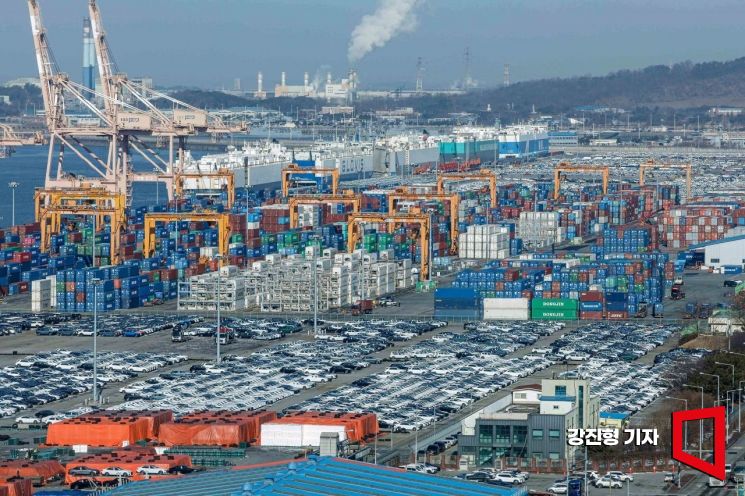 Following President Donald Trump's signing of a proclamation imposing a 25% tariff without exceptions on steel and aluminum products imported into the United States, and his announcement that tariffs on automobiles and semiconductors are also under consideration, export vehicles are waiting to be loaded at Pyeongtaek Port in Gyeonggi Province on the 13th of last month.
Per Capita GNI $36,624... Maintains 6th Place Globally Among Countries with Over 50 Million Population
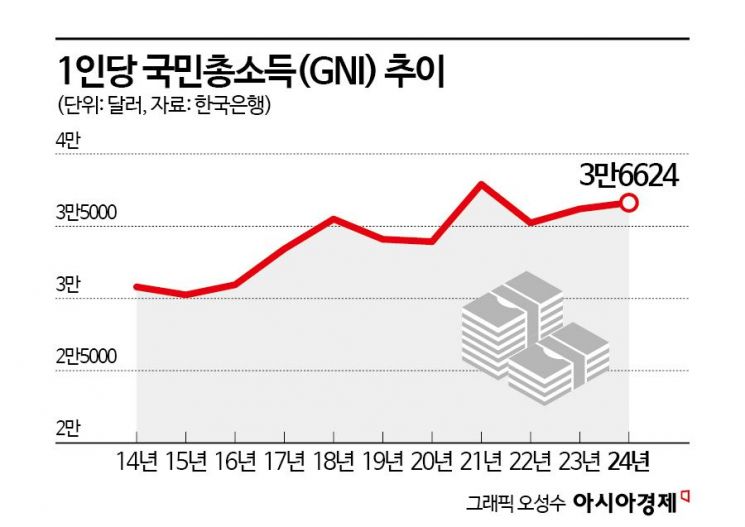
According to the '2024 Fourth Quarter and Annual National Income (Preliminary)' report released by the Bank of Korea on the 5th, last year's per capita GNI was $36,624, a 1.2% increase from $36,194 in 2023. In Korean won terms, it rose 5.7% to 49,955,000 won. Per capita GNI is a representative indicator that divides the total income earned by citizens domestically and abroad over a year by the population, reflecting the standard of living.
South Korea's per capita GNI first entered the $30,000 era in 2014 ($30,798) and grew to $37,898 by 2021. However, it fell back to the $35,000 level ($35,229) in 2022 before recovering to the $36,000 range ($36,194) in 2023, and remained in the $36,000 range last year as well.
Kang Chang-gu, head of the National Income Department 2 at the Bank of Korea, said, "Last year's per capita GNI growth rate was 1.2%, but the nominal GNI growth rate was 5.8%," adding, "The average won-dollar exchange rate rose 4.5% last year, causing the won's value to depreciate." The average annual won-dollar exchange rate last year reached a high level of 1,363.98 won, up 58.57 won from the previous year.
Last year, South Korea's per capita GNI surpassed that of Japan and Taiwan again. Kang said, "According to Taiwan's statistics bureau, Taiwan recorded $35,188 last year, and Japan's per capita GNI, calculated by applying exchange rates and population to the announced total GNI amount, was estimated to exceed $34,500," adding, "It is expected to be higher than Japan and Taiwan as in the previous year." However, he noted that the currency values affecting per capita GNI in dollar terms should be considered. Last year, the depreciation rate of the Japanese yen was 7.4%, higher than the Korean won's 4.3%. The Taiwan dollar depreciated by 3.0%.
Last year, South Korea's per capita GNI was expected to rank sixth among countries with populations over 50 million, following the United States, Germany, the United Kingdom, France, and Italy. Italy's per capita GNI last year was estimated to be around $38,500 based on International Monetary Fund (IMF) forecast data. The timing for achieving a per capita GNI of $40,000 is still expected to be "within a few years," assuming exchange rate stability. Kang said, "Nominal GNI generally continues to increase except in some crisis situations, but exchange rates have a significant impact," adding, "The IMF had forecast $41,000 for 2027, but considering the increased volatility of South Korea's exchange rate since then, this needs to be monitored further."
Last year's real GNI increased by 3.5% compared to the previous year, significantly exceeding the GDP growth rate. Although real net primary income from abroad decreased from 38.1 trillion won to 31.6 trillion won, the improvement in terms of trade reduced real trade losses from 91.4 trillion won to 53.1 trillion won.
Economic Growth Rate: 0.1% in Q4, 2.0% Last Year... Same as Flash Estimates
South Korea's real GDP growth rate for the fourth quarter last year (preliminary, quarter-on-quarter) was 0.1%. This figure matches the flash estimate announced by the Bank of Korea in January. However, reflecting some year-end data that was not available at the time of the flash estimate, exports (up 0.5 percentage points), government consumption (up 0.2 percentage points), and imports (up 0.2 percentage points) increased compared to the flash estimate. Conversely, construction investment and facility investment were revised downward by 1.3 percentage points and 0.4 percentage points, respectively.
By economic activity, manufacturing increased by 0.2%, centered on chemicals and chemical products, computers, electronics, and optical equipment. Construction decreased by 4.1%, with declines in both building and civil engineering construction. Services increased by 0.4%, despite decreases in real estate, wholesale and retail, and accommodation and food services, due to increases in finance and insurance, medical, health, and social welfare services.
By expenditure item, private consumption increased by 0.2%, as consumption of goods such as passenger cars, electricity, gas, and other fuels decreased, but consumption of services such as medical care and education increased. Government consumption rose by 0.7%, mainly due to health insurance benefit expenditures. Construction investment decreased by 4.5%, with declines in both building and civil engineering construction. Facility investment increased by 1.2%, as machinery such as semiconductor manufacturing equipment rose despite a decrease in transportation equipment like passenger cars. Exports increased by 0.8%, centered on IT items such as semiconductors, and imports increased by 0.1%, with machinery and equipment rising.
Last year's real GDP grew by 2.0% compared to the previous year, also matching the flash estimate. By economic activity, construction turned to a decrease, but manufacturing expanded its growth. By expenditure item, private consumption growth slowed, and construction investment turned to a decrease, but exports, government consumption, and facility investment all expanded their growth.
South Korea's GDP deflator rose 4.1% last year compared to 2023, a much larger increase than the 1.9% rise the previous year. The GDP deflator is a macroeconomic indicator that divides nominal GDP by real GDP, reflecting the overall price level including exports and imports.
© The Asia Business Daily(www.asiae.co.kr). All rights reserved.


