Ministry of Land, Infrastructure and Transport Announces Land Price Change Rate and Land Transaction Volume for First Half of Year
Land Transaction Volume Increases by 3.1% Compared to Second Half of Last Year
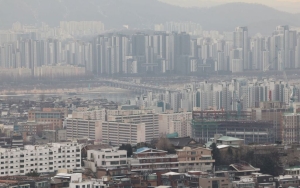
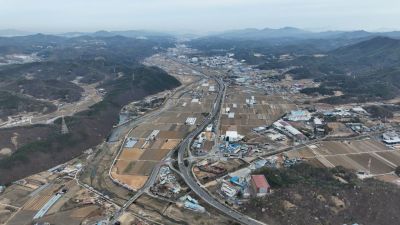 A panoramic view of Idong-eup and Namsa-eup areas in Cheoin-gu, Yongin Special City, designated as a candidate site for the national advanced industrial complex for the system semiconductor cluster.
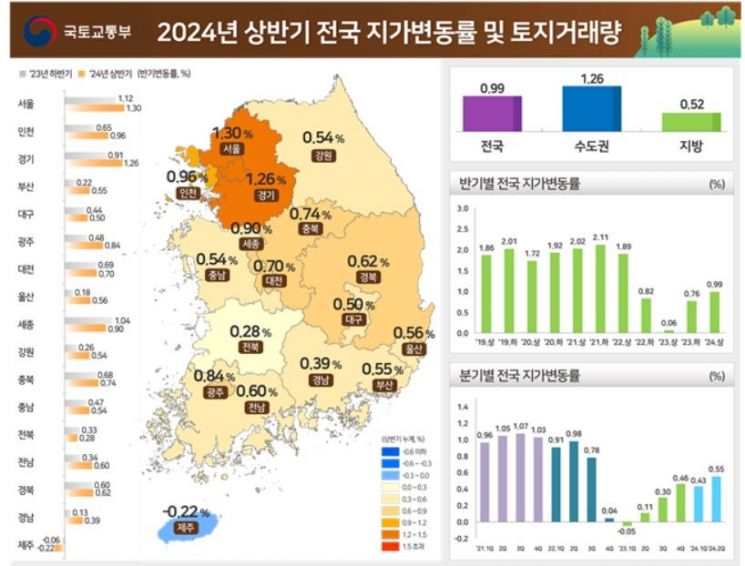
Cheoin-gu, Yongin-si, where the advanced system semiconductor national industrial complex and semiconductor cluster general industrial complex are planned, was identified as the area with the highest land price increase in the first half of this year. As land prices in Gyeonggi and Seoul, including Yongin, surged, the nationwide land price rose more than the same period last year. With the rise in land prices, tax burdens are also expected to increase.
The Ministry of Land, Infrastructure and Transport and Korea Real Estate Board announced the land price change rate and land transaction volume for the first half of this year on the 25th. Nationwide land prices rose by 0.99% in the first half of this year. The increase was 0.23 percentage points higher than the second half of last year. It expanded by 0.93 percentage points compared to the first half of last year (0.06%).
Nationwide Land Prices Rise for 16 Consecutive Months
Nationwide land prices have risen for 16 consecutive months since turning positive in March last year (0.008%). The increase rate has gradually expanded over the last three months: 0.178% in April → 0.183% in May → 0.190% in June. Land prices showed higher levels than the second half of last year’s change rate regardless of region, with the metropolitan area (0.99% → 1.26%) and provinces (0.37% → 0.52%) both rising.
By city and province, Seoul (1.12% → 1.30%) and Gyeonggi (0.91% → 1.26%) exceeded the national average (0.99%). Among 252 cities, counties, and districts, 53 areas had higher rates than the national average, including Cheoin-gu, Yongin (3.02%), Sujeong-gu, Seongnam (2.90%), and Gunwi-gun (2.64%).
Park Won-gap, Senior Real Estate Specialist at KB Kookmin Bank, said, "In the case of Cheoin-gu, Yongin, the rise was due to the positive effects of the semiconductor cluster, and Sujeong-gu, Seongnam saw land prices increase due to redevelopment. However, the official land price used as a basis for property tax and the land price change rate do not always move in the same direction, so a rise in land prices does not necessarily mean taxes will also increase."
Among 252 cities, counties, and districts, 220 showed a range of 0.00% to 1.20%. Eight metropolitan area districts were included in the top 10. The land price change rate in population-decreasing areas in the first half of this year was 0.448%, which was 0.585 percentage points lower than the 1.033% in non-target areas.
By usage and utilization status, commercial areas rose by 1.09%, and industrial areas by 1.19%.
Ham Young-jin, Head of Real Estate Research Lab at Woori Bank, said, "Land prices in Seoul and Gyeonggi rose more than 1% in the first half of this year, and if this trend continues into the second half, the total land price increase in Seoul and Gyeonggi for this year will exceed 2%."
Land Transactions Also Increase
The total land transaction volume (including land attached to buildings) in the first half of this year was about 930,000 parcels (663.8 km²). This is a 0.6% increase compared to the first half of last year and a 3.1% increase compared to the second half of last year.
The total land transaction volume in the first half of this year increased in 10 cities and provinces compared to the second half of last year, including Ulsan by 19.5% and Sejong by 14.6%. Pure land transaction volume increased in 11 cities and provinces, including Daejeon by 17.7%, Sejong by 15.5%, Jeonbuk by 14.7%, and Jeonnam by 14.7%.
Looking at land transaction volumes by land use area and building use, agricultural and forest areas increased by 33.4%, rice paddies by 17.2%, and residential areas by 10.4% compared to the second half of last year.
© The Asia Business Daily(www.asiae.co.kr). All rights reserved.


