[Asia Economy Reporter Lee Seon-ae] The decline in the US Nasdaq index and the Korean KOSPI index is raising alarms that the 'dot-com bubble crisis' is repeating. Although the stock market has fallen to levels seen during the dot-com bubble collapse, there is an optimistic view that the difference in valuation provides some driving force for recovery. However, forecasts on the 'bottom' of Nasdaq and KOSPI diverge. The growing warnings of further sharp declines in Nasdaq suggest that escaping the 2600 level on the KOSPI, which is inevitably affected, will not be easy?this is the current state of the domestic stock market.
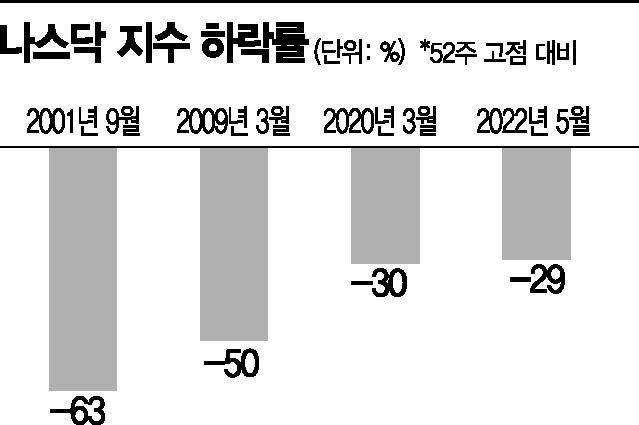
According to Bloomberg on the 20th, Nasdaq's decline was 9% from January to March, but the drop has accelerated since May. As of the 19th (local time), the year-to-date decline rate is 28%. Compared to the 552-week high, the decline rate is 29%. Considering the 30% drop during the COVID-19 period, many analyses suggest this exceeds a typical correction level. This is why concerns about a repeat of the dot-com bubble collapse are emerging. The dot-com bubble refers to the rapid rise and subsequent crash of internet-related companies' stock prices from the mid-1990s to the early 2000s. Nasdaq was only in the 1300s in 1997 but soared to the 5000s by March 2000. Afterward, the bubble burst, and it fell back to the 1000s.
However, the difference from the dot-com bubble period lies in valuation. At the peak of the dot-com bubble, the Nasdaq 100's price-to-earnings ratio (PER) rose as high as 92 times. Recently, the Nasdaq 100 PER is around 25 times. This has returned to levels seen before Nasdaq's sharp rise in 2018?2019. Therefore, optimistic forecasts suggest that if this does not lead to a global financial crisis, the additional decline may not be significant. However, pessimistic views are more prevalent.
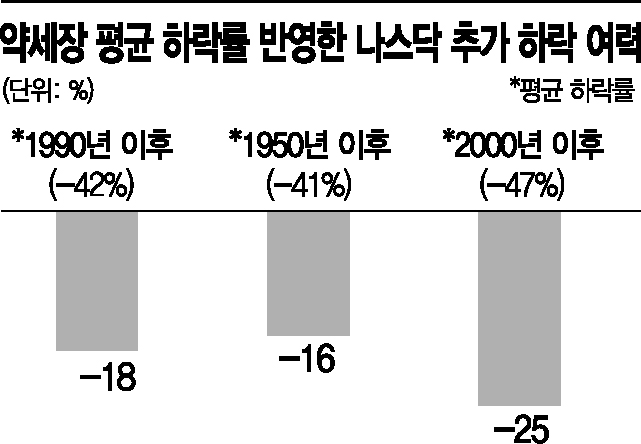
Choi Bowon, a researcher at Korea Investment & Securities, emphasized, "Since characteristics of a past bear market are visible, a conservative approach is necessary given the potential for high volatility in US indices." Generally, a market is considered bearish if the index falls more than 20% from its peak. He analyzed, "Considering the average decline rates since 1990 (42%), since 1950 (41%), and since 2000 (47%), Nasdaq still has room for additional declines of 18%, 16%, and 25%, respectively."
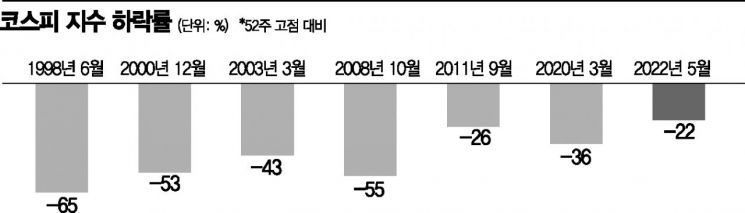
On the 19th, the KOSPI fell 1.3%, closing below the 2600 level. It started trading above 2600 on the 20th, but the current index is 22% lower compared to the 52-week high. However, this is a typical correction level compared to past crises. The decline rate during the COVID-19 crisis reached 36%. During the 2008 global financial crisis, the decline rate was 55%, and during the dot-com bubble collapse, it was 53%. Heo Jae-hwan, a researcher at Eugene Investment & Securities, said, "The KOSPI has fallen as much as it should," and predicted, "Unless the global economy falls into a recession or crisis, the possibility of dropping below the 2500 level is low."
However, if there is room for further decline in Nasdaq, the KOSPI will inevitably be affected. When Nasdaq plunges, growth stocks within KOSPI also fall sharply, causing the index to perform poorly. Currently, among Nasdaq 100 stocks, more than half?51 stocks?have fallen more than 30% from their 52-week highs. The number of stocks that have fallen more than 50% is 21. Among KOSPI 200 stocks, 100 have fallen more than 30% from their 52-week highs, and 20 have fallen more than 50%.
© The Asia Business Daily(www.asiae.co.kr). All rights reserved.


