Real Estate Accounts for 80% of Assets
Top 20% Have 1.2 Billion KRW, Bottom 20% Have 4.9 Million KRW
Youths Must Repay 800,000 KRW Monthly for 17 Years
Debt Burden Soars, 2030 Generation Says "I Won't Marry"
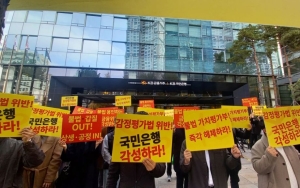
![[Ordinary People Report] Real Estate Asset Gap 251 Times... Still Buying on Debt Among 2030](https://cphoto.asiae.co.kr/listimglink/1/2022040510582416574_1649123904.jpg)
During the COVID-19 pandemic phase, real estate-driven asset inequality has been intensifying. With the proportion of real estate assets in average assets approaching 80%, the asset gap between high- and low-asset groups has widened to the highest level in four years. Consequently, the concerns of the 2030 generation, about 90% of whom bear debt burdens while joining the home-buying queue, are deepening.
Real Estate Asset Gap Between High and Low Asset Groups Reaches 251 Times
According to the ‘Ordinary People’s Financial Report’ published on the 5th by Shinhan Bank, which conducted a survey via email targeting 10,000 economically active individuals aged 20 to 64, the average household assets in Korea last year were recorded at 517.92 million KRW, an increase of 79.83 million KRW compared to the previous year.
By asset type, the proportion of real estate assets among held assets was found to be close to 80%. Real estate assets within average held assets increased by 21.1% (72.14 million KRW) to 413.86 million KRW. This accounts for 79.9% of the average household assets. The proportion of real estate assets has shown continuous growth for four years, with 75.9% in 2018, 76.0% in 2019, and 78.0% in 2020.
Real estate assets increased across all household income quintiles. For the 5th quintile (top 20%), assets rose by 107.79 million KRW to 831.30 million KRW; for the 4th quintile (top 20-40%), by 86.54 million KRW to 523.94 million KRW; and for the 3rd quintile (middle 20%), by 104.90 million KRW to 419.68 million KRW. The increase in the 5th and 3rd quintiles was larger than the total real estate asset size of the 1st quintile (bottom 20%). The 1st quintile also saw an increase of 20.52 million KRW to 87.22 million KRW, and the 2nd quintile increased by 41.00 million KRW to 207.18 million KRW. As asset sizes grew across all income quintiles, the real estate asset gap between the 5th and 1st quintiles, which was 10.8 times in 2020, decreased to 9.5 times last year.
However, the real estate asset gap between high- and low-asset groups widened to the highest level in four years. Looking at real estate asset sizes by total asset quintiles, the 5th quintile increased by 241.83 million KRW to 1.22767 billion KRW compared to the previous year, while the 1st quintile decreased by 1.1 million KRW to 4.9 million KRW. Accordingly, the real estate asset gap between the 5th and 1st quintiles reached 251 times, more than double the 125 times recorded in 2018. Shinhan Bank explained, "The increase in total assets appears to be largely influenced by real estate."
This trend aligns with previous crises such as the 1997 Asian Financial Crisis and the 2009 Global Financial Crisis. During each crisis, high-asset and high-income groups solidify their status by increasing assets and income based on stable foundations, while low-asset and low-income groups without stable asset and income bases face difficulties and risk downward social mobility. Polarization deepens with every economic crisis.
Real estate-driven asset inequality also affects the ‘quality of life.’ In this survey, respondents who rated their quality of life as ‘best’ had an average total asset holding of 761.19 million KRW, which was 2.66 times (366.90 million KRW) higher than the 285.98 million KRW average of those who rated their quality of life as ‘worst.’ This gap is higher than the income gap between the two groups (1.71 times).
"It Takes 17 Years to Pay Off a House" - 2030 Generation Giving Up Marriage and Childbirth
As real estate-driven asset inequality deepens, concerns among young people preparing for marriage and childbirth are growing. According to this report, the proportion of 2030 generation households that purchased a residence in the past year increased by 1 percentage point from the previous year to 7.2%. Among the homes purchased, 84.1% were apartments.
The problem lies in the financing method of 2030 households, which is ‘loans.’ Among the 2030 generation who purchased homes, 89.8% used loans, an increase of 14.7 percentage points from 2020. This is about 10 percentage points higher than the loan usage rate of all age groups (79.1%).
Looking more closely, the average price of homes purchased by young people was 364.46 million KRW, of which the loan amount was 167.20 million KRW. Home prices rose by 33.52 million KRW compared to the previous year, while loan amounts increased by 49.55 million KRW. The increase in loans translates directly into debt burdens for the younger generation. The 2030 generation is repaying an average of 800,000 KRW monthly over 17.4 years.
Nevertheless, 56.9% of young people still want to purchase homes with debt. This exceeds the average for all age groups (53.9%). Due to insufficient income capacity, only 10.8% responded that they plan to purchase a home within two years, which is below the all-age average of 11.6%.
This rise in home prices and the resulting increase in debt also influence the 2030 generation’s views on marriage and childbirth.
The proportion of newlywed households in their first year of marriage was 4.5%, down 1.9 percentage points from 6.4% four years ago. When asked about burdens during marriage preparation, more than half (55.0%) cited "housing preparation." During the same period, marriage costs increased from 134.04 million KRW to 169.16 million KRW, with 97.8% (34.37 million KRW) of the increase attributed to housing preparation.
The proportion of 2030 couples who do not want to have children also rose by 5.8 percentage points over four years, from 11.6% to 17.4%. Among reasons for not intending to have children, 58.0% cited value-based reasons, followed by economic reasons at 18.0%, timing reasons at 8.0%, social reasons at 6.0%, and health/family support reasons at 2.0%.
© The Asia Business Daily(www.asiae.co.kr). All rights reserved.


