[Asia Economy Reporter Park Byung-hee] The New York stock market plunged last week ahead of the Federal Reserve's (Fed) first Federal Open Market Committee (FOMC) meeting of the year (25th-26th). Investors, worried about liquidity tightening, engaged in sell-offs as expectations grew that the Fed would raise the benchmark interest rate at a considerably rapid pace starting as early as March.
However, Bloomberg reported on the 23rd (local time) that historically, the New York stock market has risen during periods when the Fed raised benchmark interest rates. Bloomberg emphasized that the Fed's rate hikes fundamentally reflect an improving U.S. economy, which in turn reflects increased corporate profits.
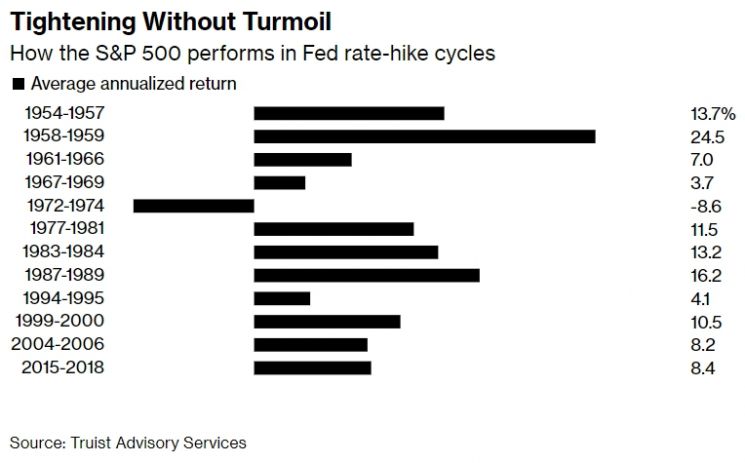
According to Truist Advisory Services, since 1950, there has been only one instance when the S&P 500 index declined during 12 periods of U.S. benchmark interest rate hikes. During these 12 rate hike periods, the S&P 500 index rose by an average of 9% annually. Even in the most recent rate hike period from 2015 to 2018, the S&P 500 index recorded an average annual increase of 8.4%.
The only time the New York stock market declined was during the 1972-1974 rate hikes, which coincided with the U.S. economic recession from 1973 to 1975.
Wall Street also predicts a rise in the New York stock market this year. According to Bloomberg's compilation, Wall Street investment strategists' year-end forecast for the S&P 500 index this year is 4982. This is about 13% higher than the current S&P 500 index and 4.5% higher compared to last year's closing price.
Some point out that the S&P 500 index rose by as much as 26.89% last year without significant corrections. In fact, last year's annual low for the S&P 500 index (3662.71) was only 2.49% below the 2020 closing price (3756.07). This indicates a predominantly upward trend without notable pullbacks.
According to Truist, since 1955, there have been ten instances where the annual low of the S&P 500 index fell less than 5% compared to the previous year, as was the case last year. In the following year, the S&P 500 index rose seven times and fell three times, with an average increase of 7%. However, the average annual low showed a 13% decline compared to the previous year, indicating increased volatility.
Last year's closing price for the S&P 500 index was 4766.18. Applying a 13% decline based on past cases, this year's annual low can be estimated at around 4146.58.
This year is also a midterm election year. In midterm election years, the New York stock market often shows a quiet trend until the second half of the year. This is interpreted as uncertainty due to the midterm election results and their potential impact on policies.
According to LPL Financial, since 1950, the annual low of the S&P 500 index in midterm election years has recorded an average decline of 17.1%, showing increased volatility. However, from the fourth quarter of midterm election years, the New York stock market showed a strong trend, and the upward momentum continued into the following year. In the year following midterm elections, the S&P 500 index rose by an average of 32.3%.
© The Asia Business Daily(www.asiae.co.kr). All rights reserved.


