Statistics Korea Releases First Income Mobility Statistics
Examining Income Trends from 2017 to 2022
Lower 1st Quintile Faces COVID-19 Income and Employment Shocks
Significant Downward Mobility Among Women Aged 65 and Over
High-Income 5th Quintile Retention Rate at 86.0%
Income Polarization Between 1st and 5th Quintiles Solidifies
Less than two out of ten South Korean citizens experienced an increase in income and a rise in their income quintile over the course of a year. While it was difficult to enter the top 20% income quintile, those who did tended to remain there for a long time, and upward mobility from the bottom 20% income group became more challenging. This phenomenon has become entrenched since the spread of COVID-19.
The Korea National Statistical Office (KOSTAT) developed and announced on the 18th the 'Income Mobility Statistics' to support key tasks such as improving social mobility and supporting vulnerable groups, which are essential for realizing a dynamic economy.
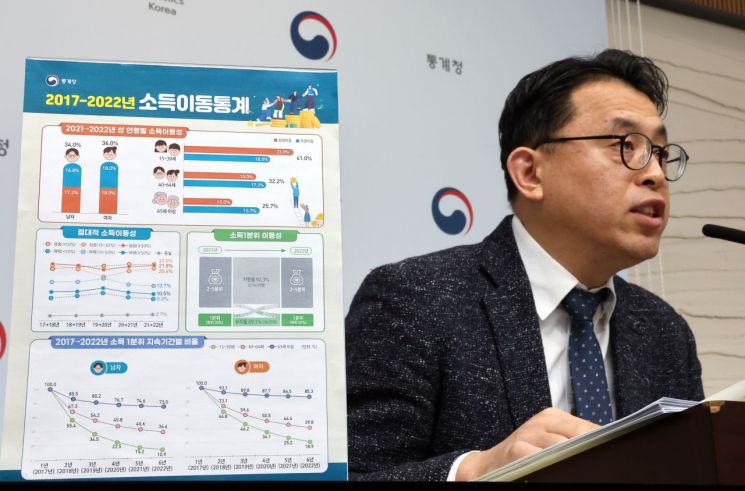 Choi Baul, Director of the Economic and Social Statistics Research Office at the National Statistical Office, is explaining the results of the 2022 Income Mobility Statistics development on the morning of the 18th at the briefing room in the Central Building of the Government Complex Sejong. Photo by Yonhap News
Income Mobility Statistics combine multi-source data such as income records from the National Tax Service to build a panel (longitudinal) database (DB) on a large-scale sample of about 11 million people. This new type of statistics captures micro-level longitudinal changes at the individual level. It is characterized by analyzing the status and characteristics of labor and business income mobility in the labor market.
Income Mobility Decreased After COVID-19
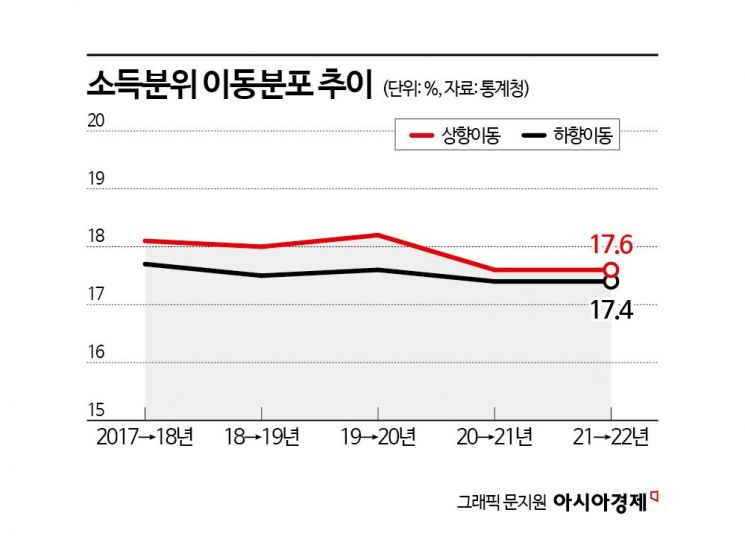
According to the 2022 Income Mobility Statistics, 34.9% of people experienced an increase or decrease in income quintile compared to the previous year. Specifically, 17.6% experienced upward mobility, which was 0.2 percentage points higher than the 17.4% who experienced downward mobility. When broken down by gender and generation, women (36.0%) showed higher income mobility than men (34.0%), and young people (41.0%) had higher mobility than the elderly (25.7%).
Looking at the time series from 2017 to 2022, income mobility fluctuations were relatively large in 2020 but showed a declining trend afterward. The rates were 35.8% in 2018, 35.5% in 2019, and 35.8% in 2020, then dropped to 35.0% in 2021 and continued downward through 2022. In particular, in 2020, the upward mobility rate of women aged 65 and over decreased by 1.1 percentage points compared to the previous year, while the downward mobility rate increased by 1.1 percentage points, highlighting a notable disparity.
Choi Baul, head of the Economic and Social Statistics Research Division at KOSTAT, explained, "In 2020, income and employment shocks appeared in the lowest income quintile." He added, "During the COVID-19 period, downward mobility was significant among women aged 65 and over, as well as women of all ages. It is possible that their ability to climb back to the 2nd, 3rd, and 4th quintiles during the recovery phase after COVID-19 has weakened."
Choi also stated, "It was already difficult for women aged 65 and over to move upward through income in the labor market, but the COVID-19 shock caused them to fall further. This situation could be mitigated by expanding government policies on senior employment or increasing public transfer income such as basic pensions."
By income quintile, the 2nd quintile had the highest mobility rate in 2022 at 50.1%. This was followed by the 3rd quintile (45.2%) and the 4th quintile (34.4%). Among those in the 2nd quintile, 21.3% moved downward to the 1st quintile, while 28.8% moved upward to the 3rd quintile or higher. Conversely, the 3rd and 4th quintiles had higher proportions of downward mobility at 27.2% and 24.2%, respectively, than upward mobility.
Yearly trends show that income mobility in the lower 1st and 2nd quintiles has declined since 2020, while the 3rd to 5th quintiles have fluctuated. In particular, upward mobility in the 1st and 2nd quintiles decreased after 2020. The 1st quintile dropped from 32.2% in 2020 to 30.9% in 2022, and the 2nd quintile from 30.0% to 28.8%. This indicates that income growth in the lower quintiles has become more difficult since the spread of COVID-19.
Entrenchment of Wealthy and Poor Groups Strengthened
In 2022, the income quintile retention rate was highest for the high-income 5th quintile at 86.0%. About nine out of ten people in the 5th quintile in 2021 maintained their income status without falling to a lower quintile the following year. The high retention rate in the 5th quintile reflects the difficulty of entering this group compared to others and the low likelihood of falling back once successfully entered.
The rate of moving from the 4th quintile in 2021 to the 5th quintile the next year was 10.2%, the lowest among movements between other quintiles (1→2, 2→3, 3→4). Conversely, the rate of moving from the 5th quintile in 2021 down to the 4th quintile the next year was 9.5%, also the lowest among quintile movements.
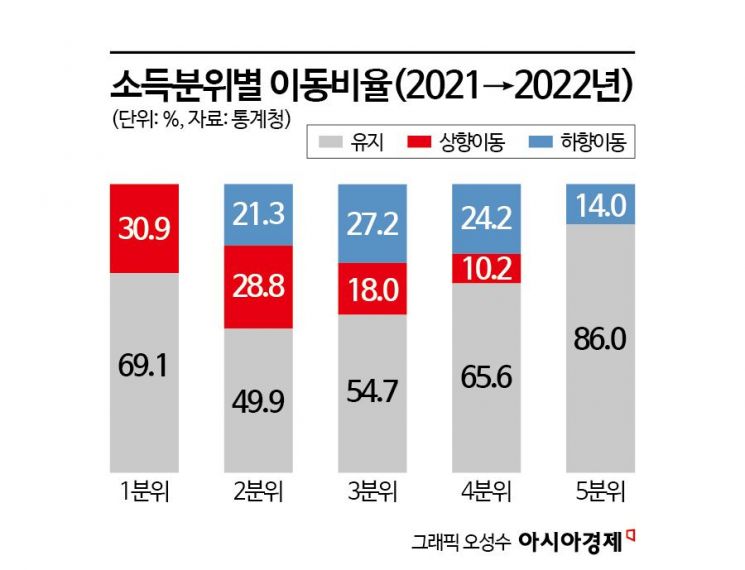
The income quintile retention rate for the poor 1st quintile was 69.1%, the second highest after the 5th quintile. This means that seven out of ten people in the bottom 20% remained in poverty the following year. The fact that the 5th and 1st quintiles have higher income retention rates than other quintiles suggests a strong possibility of income polarization becoming entrenched. The retention rates for the 4th and 3rd quintiles were 65.6% and 54.7%, respectively. The 2nd quintile was the only one below 50%, at 49.9%.
Upward mobility, or 'ascending mobility,' generally decreased as income levels increased. Among the poor in the 1st quintile in 2017, 31.3% remained in the 1st quintile through 2022. Men and young people escaped the 1st quintile faster than women and the elderly. Among those in the 5th quintile in 2017, 63.1% remained in the same quintile through 2022.
Income Increased After 2020, but Majority Less Than 10%
Looking at absolute income mobility, as of 2022, 64.4% of people had an increase in income compared to the previous year, nearly twice the 32.9% who experienced a decrease. The proportion of people with increased income fell from 63.0% in 2018 to 62.1% in 2019, then showed a rising trend after 2020 (58.0%).
However, when dividing by the rate of income increase or decrease, the proportion of those whose income rose by less than 10% stood out most after 2020. Although income increased, the rise was relatively modest. This proportion steadily increased from 19.9% in 2018 to 21.1% in 2020 and 22.0% in 2022.
Lee Hyung-il, Commissioner of KOSTAT, said, "Through Income Mobility Statistics, we will analyze the current status and causes of social mobility and support the discovery of policy tasks at the whole-government level." He explained, "Income Mobility Statistics will contribute to policy-making based on statistical data through additional linkage with administrative data and policy effect analysis according to changing policy environments."
© The Asia Business Daily(www.asiae.co.kr). All rights reserved.

![A Woman with 50 Million Won Debt Clutches a Stolen Dior Bag and Jumps... A Monster Is Born [Slate]](https://cwcontent.asiae.co.kr/asiaresize/183/2026021902243444107_1771435474.jpg)


