Average Household Assets Increase to 540.22 Million KRW
Assets Rise in 5th and 4th Quintiles, Decrease in 1st, 2nd, and 3rd Quintiles
Household Debt Decreases by 0.6% to 91.28 Million KRW
Average Income 71.85 Million KRW... Record High Increase
Last year, the average income increase per household in both amount and rate recorded the highest levels since related statistics began. The asset gap by income quintile also widened.
As of this year, household debt decreased for the first time, influenced by single-person households and others. However, the average debt size among households holding debt increased. The total amount of financial debt also rose.
Debt Decreased for the First Time Last Year... But Average Household Debt Size Expanded
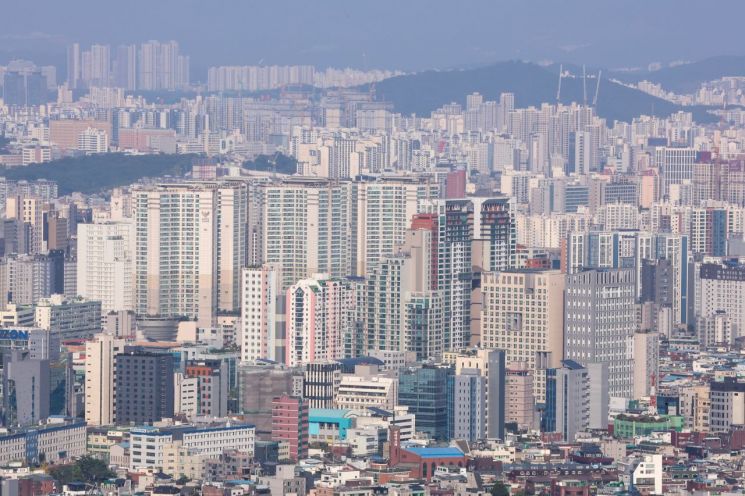
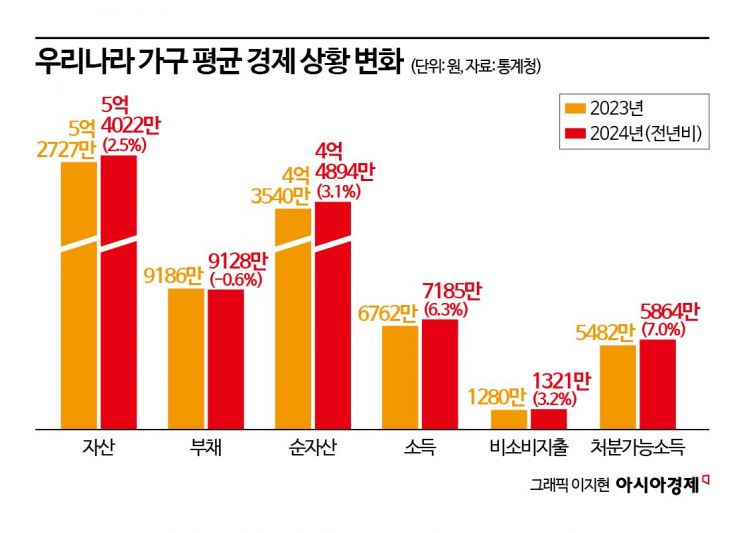
As of the end of March this year, the average household assets amounted to 540.22 million KRW, a 2.5% increase compared to the previous year. Financial assets increased by 6.3% to 133.78 million KRW due to increased savings. Real assets rose by 1.3% to 406.44 million KRW, rebounding from last year's decline to an increase this year, driven by increased holdings of real estate other than the primary residence.
Breaking down by income quintiles, assets in the 5th and 4th quintiles increased by 5.4% and 2.7% respectively, while the 1st quintile decreased by 2.0%, the 2nd by 0.7%, and the 3rd by 2.1%. This indicates a widening asset gap by income quintile. By age group, assets increased among those aged 60 and above, as well as those in their 40s and 50s. Conversely, those aged 39 and under saw a 6.0% decrease.
The average household debt was 91.28 million KRW, a 0.6% decrease. This is the first reduction in debt since related statistics began in 2012. Specifically, financial debt decreased by 0.8% to 66.37 million KRW, and rental deposits also fell slightly by 0.1% to 24.91 million KRW. The proportion of households holding debt also dropped by 1.4 percentage points to 60.7%.
Park Eun-young, head of the Welfare Statistics Division at Statistics Korea, analyzed, "The decrease in the proportion of households holding debt and the overall average debt is due to an increase in single-person households and households aged 60 and above, which have little or no debt, caused by changes in household structure."
In fact, the average debt size among households holding debt was 150.43 million KRW, a 1.6% increase from the previous year. Even when considering only households with financial debt (54.1% of all households), the average debt was 122.61 million KRW, up 2.1% from last year. Statistics Korea also explained that the total amount of financial debt increased this year.
By income quintile, debt in the 2nd quintile increased by 4.3% compared to the previous year, while all other quintiles saw decreases. By age, debt increased by 4.9% and 2.0% among those in their 40s and 50s or older, respectively, but decreased by 5.2% among those aged 39 and under. By household head’s employment status, temporary and daily workers’ debt decreased by 4.0%, showing the largest decline.
Net assets, calculated by subtracting debt from assets, increased by 3.1% to 448.94 million KRW. Households with net assets below 300 million KRW accounted for 56.9%, a majority, while those with 1 billion KRW or more made up 10.9%. Compared to last year, the proportion of households with less than 100 million KRW decreased by 0.5 percentage points, and those with 1 billion KRW or more increased by 0.6 percentage points.
Looking at the share of net assets by decile, the top 10th decile held 44.4% of total household assets, a 1.0 percentage point increase from the previous year. The net asset Gini coefficient, which indicates inequality in net assets, rose by 0.007 to 0.612 compared to the previous year.
Household Income Increase Rate and Amount Reach All-Time High
Last year, the average household income was 71.85 million KRW, a 6.3% (4.23 million KRW) increase from the previous year. This is the highest growth rate since related statistics began, and the increase amount also set a record high. Earned income was 46.37 million KRW, up 5.6%, accounting for 64.5% of total income. Business income and property income also increased.
By income quintile, income generally increased. The 1st quintile rose by 7.1% compared to the previous year, and the 5th quintile increased by 6.4%. The income share of the 5th quintile households was 46.2%, up 0.1 percentage points from the previous year. By household head’s age, those aged 60 and above saw a significant 10.0% increase, while those aged 39 and under increased by 1.1%.
Non-consumption expenditures rose by 3.2% to 13.21 million KRW. Specifically, public pensions and social insurance premiums increased by 4.4 million KRW, and taxes rose by 4.3 million KRW, marking increases of 1.6% and 3.3% respectively compared to the previous year. Interest expenses increased by 5.3% to 2.6 million KRW. Among these, public pensions and social insurance premiums accounted for the largest share at 33.3%.
Disposable income, calculated by subtracting non-consumption expenditures from income, increased by 7.0% to 58.64 million KRW. Households with disposable income below 40 million KRW accounted for 41.9% of the total, a 2.8 percentage point decrease from the previous year. Households with disposable income of 100 million KRW or more made up 14.5%, a 2.2 percentage point increase.
Last year, the Gini coefficient based on equivalized market income was 0.392, down 0.004 from the previous year. The Gini coefficient based on equivalized disposable income also decreased by 0.001 to 0.323. The income quintile ratio was 5.72 times, a decrease of 0.04 times from the previous year.
The relative poverty rate, which is the proportion of the population with income below 50% of the equivalized disposable median income, remained unchanged at 14.9% last year. However, the relative poverty rate among the retired population aged 66 and above rose slightly by 0.1 percentage points to 39.8%.
Increased Interest in Stocks and Personal Pensions for Financial Asset Investment
When households have increased income or surplus funds, their preferred uses were 'savings and financial asset investment' at 53.3%, 'real estate purchase' at 22.7%, and 'debt repayment' at 20.1%. Compared to the previous year, savings and financial asset investment increased, while debt repayment decreased.
Preferred methods of financial asset investment were deposits (87.3%), stocks (9.8%), and personal pensions (1.7%). Compared to the previous year, deposits decreased, but the shares of stocks and personal pensions increased. When considering financial asset investments, households prioritized safety, profitability, liquidity, and accessibility in that order.
The Household Finance and Welfare Survey aims to assess financial soundness by examining household assets, debts, income, and expenditures, and to microscopically understand the level and changes in economic life. The survey is conducted annually by Statistics Korea in cooperation with the Financial Supervisory Service and the Bank of Korea, targeting about 20,000 sample households nationwide.
© The Asia Business Daily(www.asiae.co.kr). All rights reserved.


