BOK Announces 2023 National Balance Sheet (Preliminary)
National Wealth 2,303.9 Trillion KRW... 2.1% Increase
Per Capita Household Net Assets 244.27 Million KRW... 1.8% Increase
At the end of last year, the estimated per capita household net assets in South Korea reached 244.27 million won, marking a 1.6% increase from the previous year. Although non-financial assets such as land declined due to continued decreases in real estate prices, the rise in financial assets driven by a stock market rebound offset these losses.
According to the "2023 National Balance Sheet (Provisional)" released on the 18th by the Bank of Korea and Statistics Korea, the nation's total net assets, which can be considered the country's wealth, amounted to 2,303.9 trillion won last year, up 2.1% (472 trillion won) from the previous year. However, the growth rate slowed from 3.1% in 2022 to 2.1% in 2023. The ratio of net national assets to nominal Gross Domestic Product (GDP) fell to 9.6 times from 9.7 times the previous year.
The slowdown in net asset growth was due to a continued decline in non-financial assets, particularly land assets, alongside a significant deceleration in the growth of net financial assets. Land assets decreased by 38.4 trillion won, continuing the downward trend from the previous year. Net financial assets, calculated as financial assets minus financial liabilities, increased by 3% (30.3 trillion won), a sharp slowdown compared to the 24.9% growth seen last year.
This was because the nominal holding gains on land remained low at around 73 trillion won, following 45 trillion won the previous year, amid ongoing land price declines. Additionally, changes in financial assets excluding transactions decreased by about 17 trillion won, turning from a gain of 178 trillion won the previous year into a loss. The changes in financial assets excluding transactions were more significantly influenced by fluctuations in foreign financial liabilities than foreign financial assets, due to domestic and international stock price increases and exchange rate variations.
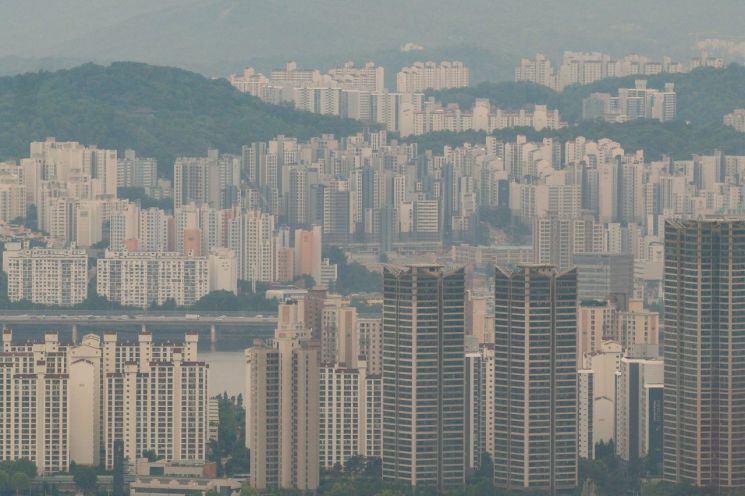
Meanwhile, the proportion of real estate (land + buildings) within non-financial assets slightly decreased from 77.2% to 76.6%. The housing market continued its two-year decline in market capitalization due to falling housing prices last year. Housing market capitalization fell by 286 trillion won in 2022 and decreased by another 118 trillion won last year, maintaining the downward trend for two consecutive years. The ratio relative to GDP also dropped from 3.0 to 2.8.
Land assets also continued their decline for the second consecutive year, decreasing by 129 trillion won in 2022 and by 38 trillion won last year. Consequently, the ratio of land assets to GDP fell to 5 times from 5.2 times the previous year.
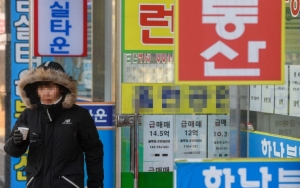
Per Capita Household Net Assets Increase by 1.6%... Attributed to Falling Housing Prices and Stock Market Rebound
At the end of last year, per capita household net assets were estimated at 244.27 million won, a slight 1.6% increase from 240.39 million won the previous year. This figure is derived by dividing the net assets of households and non-profit organizations by the estimated population (approximately 51.71 million people).
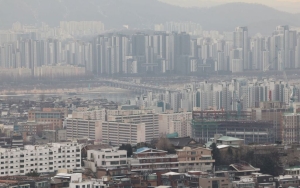
At the end of last year, the net assets of households and non-profit organizations totaled 1,263.2 trillion won, reversing a 180 trillion won decrease in 2022 to a 210 trillion won (1.7%) increase last year. This shift was driven by a decline in non-financial assets centered on housing assets, offset by a significant increase in financial assets due to the stock market rebound. Housing assets decreased by 147 trillion won, a 2.3% drop from the previous year, while financial assets rose by 233 trillion won, a 4.7% increase. Equity securities and investment funds increased by 161 trillion won.
Examining the composition of net assets, housing accounted for the largest share at 50.3%. Other real estate made up 25.2%, cash and deposits 19.1%, and insurance and pensions 11.5%. The proportion of real estate within the net assets of households and non-profit organizations rose from 77.1% in 2022 to 75.5%.
Looking at net national assets by institutional sector, households and non-profit organizations held 54.8% (1,263.2 trillion won), general government 24.6% (567.4 trillion won), non-financial corporations 18.2% (419.1 trillion won), and financial corporations 2.4% (54.2 trillion won).
Meanwhile, the Bank of Korea and Statistics Korea announced that they recently revised the base year of the national balance sheet from 2015 to 2020 to reflect recent changes in the economic structure. This revision is the second since the national balance sheet was first published in 2014, following an update in 2019.
As a result, the net national assets for 2020 increased by 94.2 trillion won from 1,794 trillion won to 1,888.2 trillion won. This increase is attributed to upward adjustments in investment time series due to the base year revision and improved reflection of the reality of land attached to residential and non-residential buildings.
© The Asia Business Daily(www.asiae.co.kr). All rights reserved.
![Clutching a Stolen Dior Bag, Saying "I Hate Being Poor but Real"... The Grotesque Con of a "Human Knockoff" [Slate]](https://cwcontent.asiae.co.kr/asiaresize/183/2026021902243444107_1771435474.jpg)


