Bank of Korea Announces Last Year's National Balance Sheet (Preliminary)
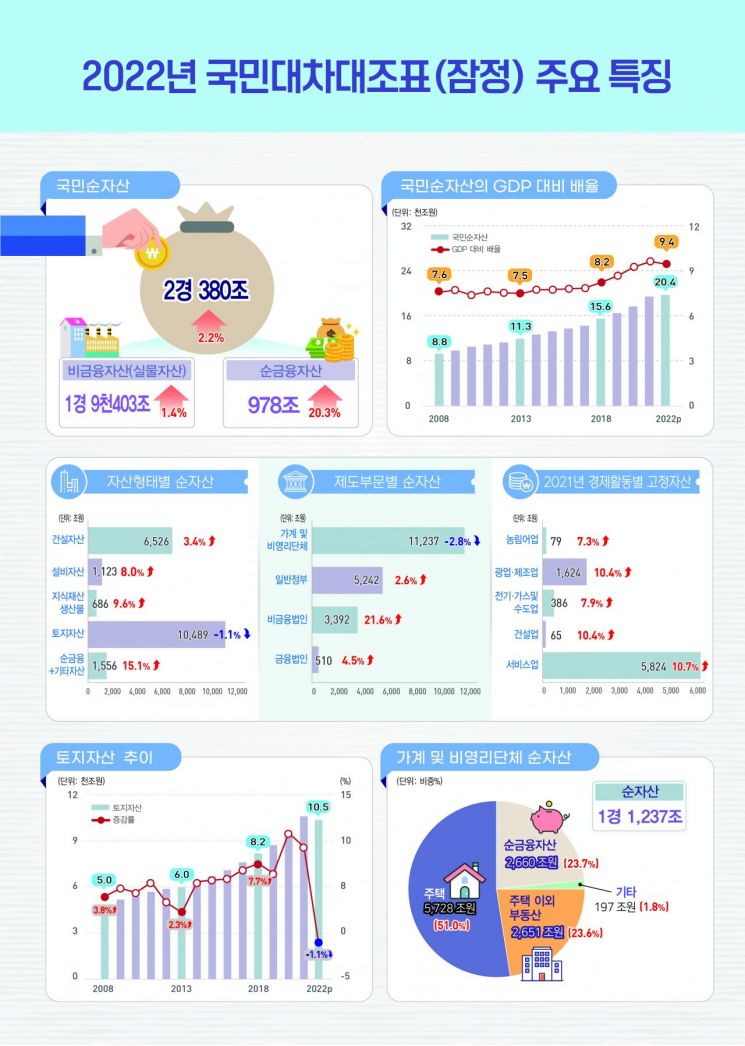
South Korea's National Wealth 2,380 Trillion Won... 2.2% Increase
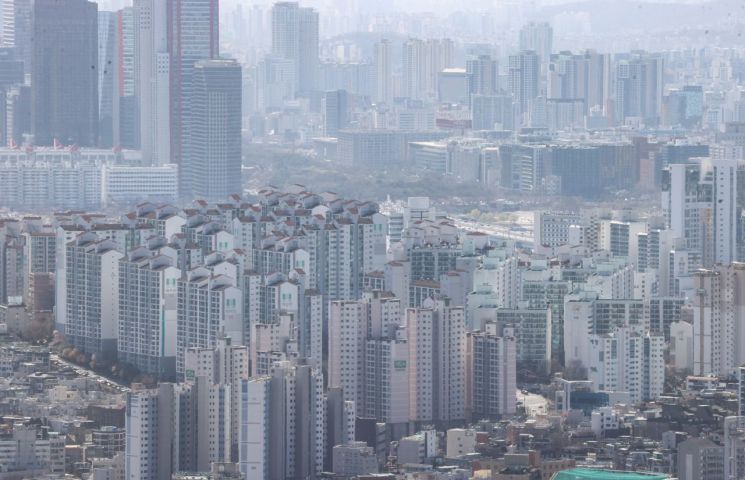
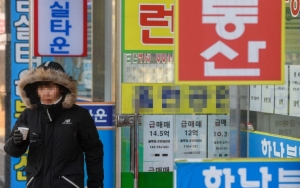
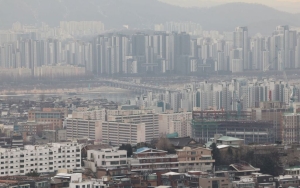
Real Estate Slump... Household and Nonprofit Assets Shrink
At the end of last year, the net assets per household in South Korea were estimated at 520.71 million KRW, a 4.1% decrease from 543.01 million KRW the previous year. Due to the real estate market downturn, housing prices and land assets declined, causing the net assets of households and non-profit organizations to decrease for the first time since the statistics were compiled in 2008.
Last Year’s 'National Wealth' at 2,038 Trillion KRW... Growth Rate Slowed
According to the provisional 2022 National Balance Sheet released by the Bank of Korea on the 20th, South Korea’s national net assets (national wealth) at the end of last year recorded 2,038 trillion KRW, showing an increase compared to the previous year. However, the growth rate sharply declined from 1,998.8 trillion KRW (11.1%) in 2021 to 441.5 trillion KRW (2.2%) last year. National net assets were 9.4 times the nominal Gross Domestic Product (GDP) of 2,162 trillion KRW, down from 9.6 times the previous year.
Non-financial assets increased by 27.6 trillion KRW (1.4%) to 1,940.3 trillion KRW compared to the previous year, and net financial assets?financial assets (2,196 trillion KRW) minus financial liabilities (2,098.2 trillion KRW)?rose by 165 trillion KRW (20.3%) to 978 trillion KRW.
The slowdown in the increase of national net assets last year was mainly due to a decrease in nominal holding gains on non-financial assets caused by falling asset prices. In fact, net acquisitions of assets only slightly decreased (from 325.9 trillion KRW to 275.5 trillion KRW), but nominal holding gains sharply shifted from a large profit of 1,357.5 trillion KRW to a loss of 74.3 trillion KRW during the same period. This decline in nominal holding gains is the first since 1998 (-140.2 trillion KRW).
By institutional sector, the scale of non-financial assets held was 8,576 trillion KRW (44.2%) for households and non-profit organizations, 6,233 trillion KRW (32.1%) for non-financial corporations, 4,355 trillion KRW (22.4%) for general government, and 238 trillion KRW (1.2%) for financial corporations. While households and non-profit organizations saw a decrease of 303 trillion KRW (-3.4%), non-financial corporations increased by 382 trillion KRW (6.5%), general government by 183 trillion KRW (4.4%), and financial corporations by 14 trillion KRW (6.4%). For households and non-profit organizations, non-financial assets decreased uniquely due to the high proportion of residential buildings and residential building-associated land, which were depressed last year.
Net Assets per Household 520.71 Million KRW... Slight Decrease
Last year, net assets per household were 520.71 million KRW. This figure is derived by dividing the net assets of households and non-profit organizations, totaling 1,123.66 trillion KRW, by the estimated 21.58 million households. The net assets of households and non-profit organizations increased by 103.61 trillion KRW (9.9%) the previous year but decreased by 31.78 trillion KRW (-2.8%) this time. This is the first decrease since the net asset compilation by institutional sector began in 2008.
The decline in non-financial assets last year, centered on housing assets, was due to the real estate market downturn (-30.27 trillion KRW), and net financial assets also slightly decreased (-1.51 trillion KRW) due to stock price declines and other factors. Although cash and deposits increased by 15.14 trillion KRW last year, equity securities and investment funds decreased by 15.18 trillion KRW.
Examining the composition of net assets for households and non-profit organizations, housing accounted for the largest share at 51.0%, followed by real estate other than housing at 23.6%, and cash and deposits at 20.4%. The proportion of real estate in the net assets of households and non-profit organizations shrank from 75.2% in 2021 to 74.6% last year.
Real estate assets, combining land and buildings, totaled 1,471 trillion KRW last year, turning to a decrease of 3.49 trillion KRW (-0.2%). Accordingly, the share of real estate in non-financial assets declined from 77.1% to 75.8%. This is the first decrease since 2012 (74.1% → 74.0%).
Decline in Total Housing Market Value... Significant Increase in Gyeonggi Province Land Assets
Due to falling housing prices, the total housing market value (6,209 trillion KRW) decreased by 342.8 trillion KRW (-5.2%) last year. This contrasts sharply with the previous year’s large increase of 772.1 trillion KRW (13.4%). Land assets also turned to a decrease (-1.1%) at 1,048.9 trillion KRW. The ratio of land assets to GDP was 4.9 times, down from 5.1 times the previous year.
When converted at last year’s market exchange rate (KRW/USD 1,291), net assets per household were 403,000 USD, down from 475,000 USD in 2021. This is lower than the United States (1,111,000 USD), Australia (999,000 USD), Canada (714,000 USD), the United Kingdom (615,000 USD), France (557,000 USD), and Japan (492,000 USD).
When converted using purchasing power parity exchange rate (832 KRW), net assets per household were 626,000 USD, also down from 636,000 USD in 2021. The ranking is the same: United States (1,111,000 USD), Australia (1,015,000 USD), Canada (759,000 USD), United Kingdom (661,000 USD), France (655,000 USD), and Japan (529,000 USD).
As of the end of 2021, by city and province, Seoul held 3,061 trillion KRW in land assets, accounting for 28.9% of total land assets, followed by Gyeonggi Province with 2,713 trillion KRW (25.6%), Gyeongnam Province with 566 trillion KRW (5.3%), and Busan with 525 trillion KRW (4.9%). Gyeonggi Province showed the largest increase at 10.8%, followed by Incheon (10.4%) and Seoul (10.2%).
© The Asia Business Daily(www.asiae.co.kr). All rights reserved.
![From Bar Hostess to Organ Seller to High Society... The Grotesque Con of a "Human Counterfeit" [Slate]](https://cwcontent.asiae.co.kr/asiaresize/183/2026021902243444107_1771435474.jpg)


