In May, the volume of commercial and office building sales transactions in Seoul rebounded, overcoming a slight decline in April. All sales transactions occurred in small and medium-sized buildings, with no large-scale transactions, and notably, the increase in transactions of small buildings stood out.
Real Estate Planet, a commercial real estate specialist company based on big data and AI, announced on the 13th that an analysis of the Ministry of Land, Infrastructure and Transport's actual transaction price data (as of July 1, 2023) revealed these results. Real Estate Planet released a report on the commercial and office building transactions in Seoul for May 2023 containing this information.
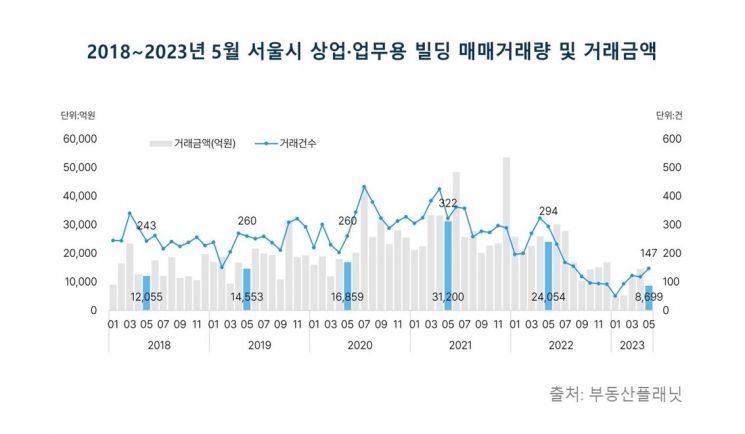
In May, a total of 147 commercial and office buildings were traded in Seoul, marking a 24.6% increase compared to April. The volume of commercial and office building transactions in Seoul showed a clear upward trend in February and March after hitting a low point in January this year, then slightly decreased in April, but rose again in May.
However, the transaction amount was recorded at 869.9 billion KRW, down 40.5% from the previous month. This was due to fewer transactions of buildings priced in the hundreds of billions of KRW, which typically influence the flow of building sales amounts. In May, only three transactions of buildings priced over 30 billion KRW occurred: a building in Yeoksam-dong, Gangnam (32.8 billion KRW), Sinsa Cheongho Building in Gangnam (31.5 billion KRW), and Namjeon Building in Gwangjin (34.2 billion KRW).
Small Buildings Account for 76.2% of Total Transactions... Driving Transaction Increase
The main driver of the increase in commercial building transactions in Seoul in May was small buildings. The number of small building transactions (under 1,000 pyeong) totaled 145, accounting for about 98.6% of all transactions. Among these, transactions of "Kkoma Buildings" (small buildings defined as general buildings owned entirely by one or jointly by a few individuals, with a total floor area exceeding 100㎡ but not exceeding 3,000㎡) increased. Kkoma Building transactions accounted for 112 cases, representing 76.2% of the total. Medium-sized building transactions (between 1,000 pyeong and under 5,000 pyeong) were only 2 cases, and no transactions occurred for large and extra-large buildings (5,000 pyeong and above).
In terms of transaction amounts, small buildings accounted for a high proportion with 823.7 billion KRW. By region, GBD (Gangnam·Seocho) recorded the highest amount among the three major areas with 246.1 billion KRW, followed by CBD (Jongno·Jung-gu) with 97.1 billion KRW, and YBD (Yeongdeungpo·Mapo) with 96.4 billion KRW. Transactions worth 384.1 billion KRW occurred in other regions.
Yeongdeungpo·Mapo Transactions Up 155.6% from Previous Month... Jongno·Jung-gu Leads Among Three Major Areas
The overall sales transaction trends showed contrasting atmospheres by region. Except for GBD, all regions saw an increase in transaction volume compared to April, but transaction amounts decreased in all regions except YBD.
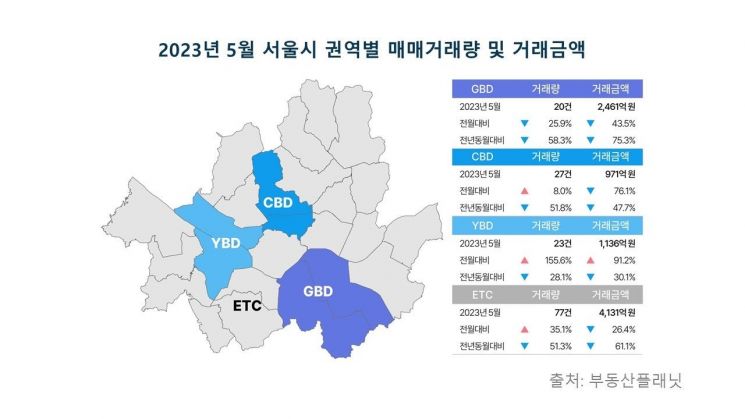
In May, the number of commercial and office building sales transactions in Seoul was 27 in CBD, 23 in YBD, and 77 in other (ETC) areas, representing increases of 8%, 155.6%, and 35.1% respectively compared to the previous month. Conversely, the GBD area recorded 20 transactions in May, a 25.9% decrease from April.
Transaction amounts were 246.1 billion KRW in GBD, 97.1 billion KRW in CBD, and 413.1 billion KRW in other areas, representing decreases of 43.5%, 76.1%, and 26.4% respectively compared to the previous month. Meanwhile, YBD recorded 113.6 billion KRW in transactions, marking a 91.2% increase and becoming the only one among the three major areas to show increases in both transaction volume and amount compared to April.
The increase in YBD transaction amounts was driven by sales such as Yeongam Building in Seogyo-dong, Mapo (18.5 billion KRW), Daedong Building in Daerim-dong, Yeongdeungpo (17.2 billion KRW), and Sangho Building in Seogyo-dong, Mapo (11 billion KRW). Conversely, the largest drop in transaction amount was seen in CBD, which decreased by 76.1% due to the previous month's transactions of Donghwa Building and Donghwa Parking Building (approximately 224.185 billion KRW).
However, compared to the same month last year, all regions showed declines in both transaction volume (28.1% to 58.3%) and transaction amount (30.1% to 75.3%), suggesting that it will take time to recover to previous years' levels.
Jongno District Most Active in Transactions... Gangnam Tops in Transaction Amount
By autonomous district, Jongno recorded the highest transaction volume with 16 sales. This was followed by Gangnam with 15, Mapo with 14, Yongsan with 12, and Jung-gu with 11 transactions.
Gangnam ranked first in transaction amount among the 25 autonomous districts, with an overwhelming 197.1 billion KRW. Following Gangnam were Mapo with 76.7 billion KRW, Yongsan with 72.1 billion KRW, Seongdong with 62.2 billion KRW, and Jongno with 59.8 billion KRW. Although Seongdong had only 9 transactions, it ranked fourth in transaction amount due to a building in Yongsan-dong being sold for 17 billion KRW.
Jung Sumin, CEO of Real Estate Planet, said, "The Seoul commercial and office building sales market, which showed some stagnation in April, revived in May centered on small buildings. Although it will still take time to recover to last year's transaction levels, the market has been showing a good trend since February this year. Therefore, those interested in investment should remain alert to properties of interest."
© The Asia Business Daily(www.asiae.co.kr). All rights reserved.


