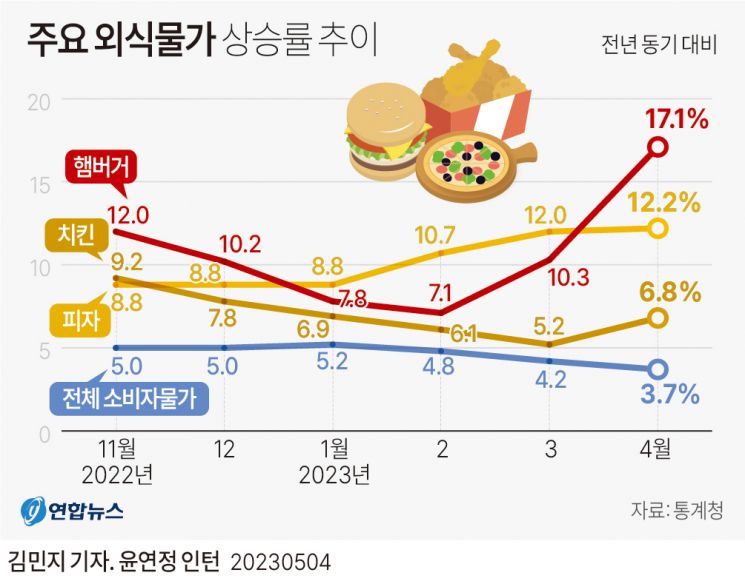
The highest cumulative increase rate is hamburgers... 2nd and 3rd are pizza and gimbap
Personal service indices such as travel also rose 0.8% in one month
The price of dining out has risen every month for 29 consecutive months without a break.
According to the National Statistical Portal of Statistics Korea on the 7th, the dining out price index last month was 117.15, up 0.7% from the previous month. The dining out price index uses 2020 as the base year at 100, and dining out prices have been on a continuous upward trend for 29 months since December 2020 compared to the previous month. The year-on-year increase rate of dining out prices rose to 9.0% in September last year but slightly eased to 7.6% last month; however, consumers' burden regarding dining out prices continues to increase every month.
The cumulative increase rate of dining out prices over 2 years and 5 months was 16.8%. Items with high increase rates included hamburgers (27.8%), pizza (24.3%), gimbap (23.2%), galbitang (22.5%), and ramen (21.2%), followed by jajangmyeon (21.0%), raw fish (20.4%), and tteokbokki (19.9%), all showing high increase rates around 20%.
The main causes of the rise in dining out prices are the accumulated increases in raw material costs such as crude oil and grains, as well as labor cost hikes. As these causes are reflected with a time lag, the upward trend in dining out prices continues without pause. Additionally, the easing of COVID-19 quarantine measures appears to have shifted demand from groceries to dining out. Especially considering that dining out demand increases in May, the month of Family Month, dining out prices are likely to rise again this month.
The personal service index excluding dining out also rose 0.8% compared to the previous month. Among 77 personal service items excluding dining out, 56 items (72.7%) increased compared to the previous month. In particular, some travel and leisure-related items such as hotel accommodation fees (5.5%), passenger car rental fees (5.0%), domestic group travel expenses (4.4%), and sports event admission fees (2.5%) rose more than 2% in one month, which is also interpreted as an effect of increased demand due to the easing of COVID-19 quarantine measures such as the removal of indoor mask mandates.
As service prices including dining out continue to rise, core inflation is also maintaining an upward trend. Despite the overall consumer price inflation slowing down due to falling petroleum prices, the rigidity of service prices, which do not easily decrease once raised, prevents the core inflation rate from lowering significantly.
Last month, the OECD-style core inflation index excluding food and energy rose 4.0% compared to a year ago, the same increase rate as the previous month (4.0%), continuing above 4% for nine consecutive months. The food and energy excluded index, which rose to 4.3% in November last year, only fell by 0.3 percentage points over five months. During the same period, the consumer price inflation rate dropped by 1.3 percentage points from 5.0% to 3.7%.
© The Asia Business Daily(www.asiae.co.kr). All rights reserved.
![Clutching a Stolen Dior Bag, Saying "I Hate Being Poor but Real"... The Grotesque Con of a "Human Knockoff" [Slate]](https://cwcontent.asiae.co.kr/asiaresize/183/2026021902243444107_1771435474.jpg)


