20 Years Since 2002

Last year, South Korea's per capita Gross National Income (GNI) fell by nearly 8% due to the rise in the won-dollar exchange rate, resulting in Taiwan overtaking South Korea for the first time in about 20 years. The per capita GNI in Korean won was 42,203,000 won, a 4.3% increase from the previous year, but due to the sharp rise in the exchange rate last year, it decreased by 7.7% in dollar terms.
According to the '2022 Q4 and Annual National Income (Provisional)' statistics released by the Bank of Korea on the 7th, last year's per capita GNI was $32,661, down 7.7% from $35,373 in 2021. Per capita national income is a representative indicator that measures the total income earned by the population domestically and abroad divided by the population, reflecting the standard of living of the people.
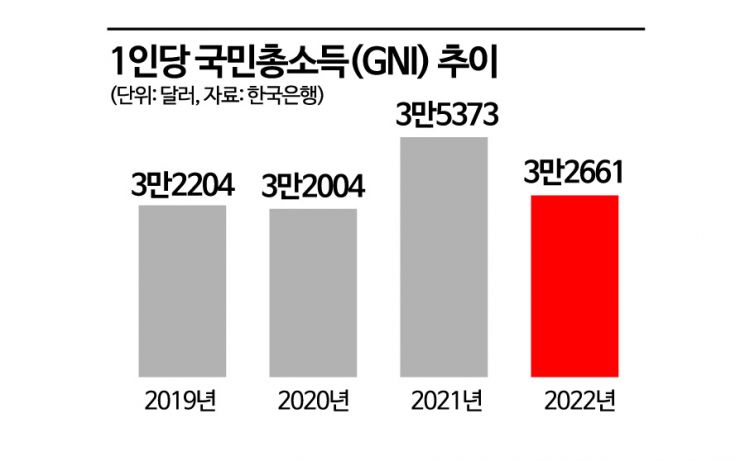
South Korea's per capita GNI first entered the $30,000 range in 2017 at $31,734. It increased to $33,564 in 2018 but declined for two consecutive years due to the impact of COVID-19, recording $32,204 in 2019 and $32,004 in 2020. In 2021, the economy recovered from COVID-19 and the exchange rate fell, leading to a rebound to $35,373 after three years, but last year, the sharp rise in the exchange rate caused per capita GNI to decline again.
Choi Jeong-tae, Director of the National Accounts Department at the Bank of Korea, said, "Last year, the won-dollar exchange rate unusually rose by an average of 12.9%, causing nominal Gross Domestic Product (GDP) to decrease by 8.1%, which led to a decline in per capita nominal GNI in dollar terms. However, nominal GDP in won terms (2,150.6 trillion won) grew by 3.8%."
The rise in the exchange rate pulled down per capita GNI, causing South Korea's per capita GNI to be overtaken by Taiwan for the first time in about 20 years. Director Choi explained, "Until 2002, Taiwan's per capita GNI in US dollars was higher than South Korea's, but from 2003 to 2021, South Korea's per capita GNI was higher than Taiwan's. This is because while the Taiwan dollar exchange rate rose by 6.8%, the won-dollar exchange rate surged by 12.9% from an average of 1,144 won to 1,292 won." In 2021, South Korea's per capita GNI ranked 36th worldwide and 7th among countries with populations over 50 million.
Real GNI decreased by 1.0%, growing at a lower rate than the GDP growth rate of 2.6%. Although real net primary income from abroad increased, the scale of real trade losses expanded due to worsening terms of trade. The GDP deflator, which reflects the overall price level of the economy, rose by 1.2%. The GDP deflator is calculated by dividing nominal GDP by real GDP.
The provisional annual real GDP growth rate for last year was 2.6%, the same as the preliminary figure released in January. The fourth-quarter growth rate (compared to the previous quarter) was also -0.4%, unchanged from the preliminary figure. Sectoral growth rates were revised: fourth-quarter private consumption (-0.6%) and government consumption (2.9%) were each adjusted downward by 0.2 percentage points from the preliminary figures. In contrast, facility investment (2.7%), exports (-4.6%), and imports (-3.7%) were revised upward by 0.4, 1.2, and 0.9 percentage points, respectively.

© The Asia Business Daily(www.asiae.co.kr). All rights reserved.


