Using Korea's First Temperature Analysis Method Developed by Integrating Surface Temperature and Spatial Information
Supporting Heatwave Measures and Urban Development Policies at Eup, Myeon, and Dong Levels
[Asia Economy Reporter Lim Cheol-young] A "heat distribution map" developed using a "temperature analysis method" that integrates land surface temperature and spatial information has been created and will be provided to local governments and research institutions.
On the 19th, the National Disaster Safety Research Institute under the Ministry of the Interior and Safety announced that it has produced a "heat distribution map" that can identify nationwide heat distribution during summer using satellite data, and will provide it to local governments during the "2021 Heatwave Countermeasure Period."
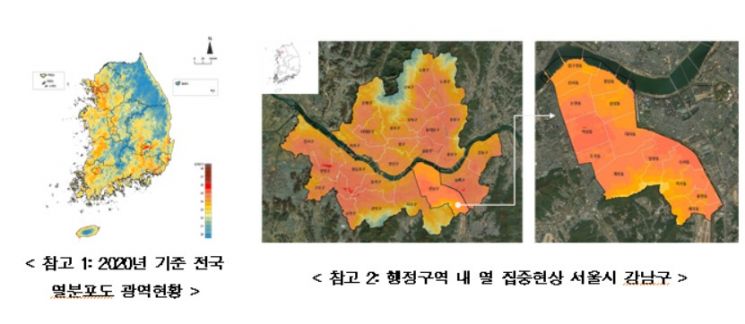
The "heat distribution map" developed by the institute is a thematic map expressing the average summer temperature (June to September) on a 30m grid, created using a "temperature analysis technique" that integrates land surface temperature observed by satellites and spatial information.
After experiencing a record-breaking heatwave in 2018, the institute judged that while point-based temperature observations provided by the Korea Meteorological Administration have the advantage of accurately measuring temperature, they have limitations in understanding spatial information, and thus began related research in 2019.
After one year of research, the institute developed a technology last year to precisely (30m resolution) identify spatially varying heat information within the same city according to building distribution and terrain using satellites. By using the "heat distribution map," it is possible to identify heat concentration phenomena on a 30m grid basis, enabling analysis of detailed high-temperature concentration phenomena from a nationwide scale down to towns, townships, and neighborhoods.
The institute plans to provide the heat distribution map for purposes such as understanding broad status, detailed status, and long-term trends. By utilizing this, the broad status can confirm the summer heat distribution across the entire country. Looking at the broad status as of last year, it can be confirmed that the metropolitan area, which is severely urbanized, the Daegu area known as a severe heat region, and the west coast region are included among the top nationwide heat concentration areas.
Examining the detailed status, it can be seen that even within metropolitan cities and provinces, heat concentration phenomena vary spatially depending on differences in land use and building distribution in city, county, and district areas. Additionally, through long-term trend analysis, changes in the heat environment due to regional environmental changes can be tracked. In the case of Buk-gu, Daegu Metropolitan City, comparing data from 2010 and 2020 shows that heat concentration phenomena have been alleviated, which is analyzed to be due to a decrease in regional temperature distribution caused by the growth of planted trees.
The institute plans to provide local governments with the "heat distribution map" along with "spatial information" that includes disaster-vulnerable groups and heatwave mitigation facilities, supporting preparation for heatwaves by considering heat concentration areas and population and environmental factors. The spatial information analysis results through the heat distribution map are expected to be usefully applied in installing heatwave evacuation spaces such as cooling shelters and shade structures. When promoting urban development projects, urban regeneration projects, and planting projects, it will be possible to understand heat distribution within the region, enabling the establishment of customized spatial utilization policies by region.
Director Lee Sang-kwon said, "As public suffering due to recent heatwaves increases, we will actively support central and local government policy implementation through research results using scientific technology and information," and added, "We will continue to collect feedback and promote improvements so that local governments can use the heat distribution map more conveniently in the future."
© The Asia Business Daily(www.asiae.co.kr). All rights reserved.


