NH Nonghyup Bank Analyzes Five Years of Teenage Customer Data
Convenience Stores Are the Top Spending Spot for Middle and High School Students
MegaMGC Is the Most Popular Coffee Choice
Olive Young Sees More Purchases During Sale Periods and Online
Daiso Is Most Visited in March and May
It has been found that the place where teenagers, including middle and high school students, spend the most money is convenience stores. When visiting coffee shops, they tend to consider so-called cost-effectiveness (value for money), and in the case of Olive Young, they often make purchases during sale periods or pay online.
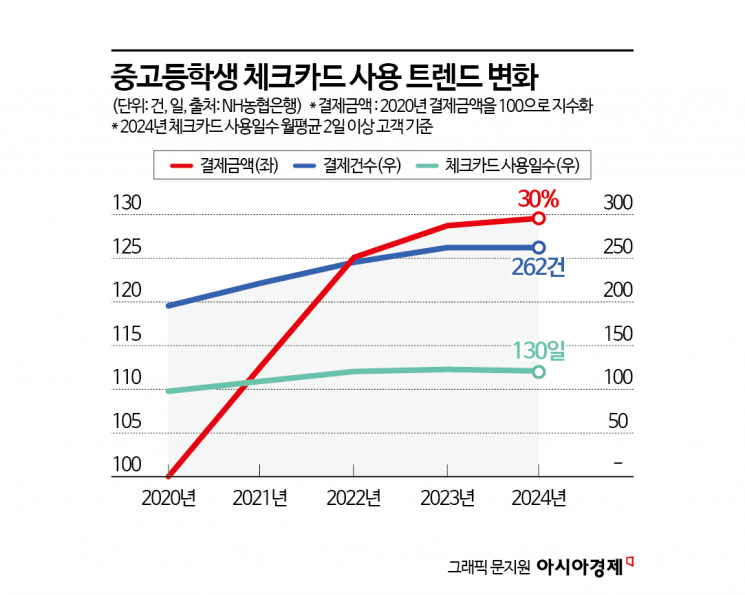
According to NH Nonghyup Bank's analysis of its teenage customer data (including card and financial assets) over the past five years from 2020 to last year, the use of debit cards by teenagers has steadily increased over the five-year period. The annual per capita spending by middle and high school students reached 1.75 million won last year, a 30% increase compared to 2020. The number of days spent using cards annually also rose from 107 days to 130 days. The proportion of teenagers making more than two purchases per day increased from 18% to 29%, indicating that debit card usage has become a routine part of daily life for teenagers, according to the bank.
Looking at the spending patterns of teenagers, their consumption is generally concentrated in the spring and fall. For elementary and middle school students, spending increased with the start of the school year in March, reaching approximately 80,000 won and 110,000 won, respectively, through debit card use in May. For high school students, the figure was about 210,000 won, with the highest spending occurring in December (about 230,000 won). This increase is attributed to high school students enjoying their free time after completing the college entrance exam. In December, the sector with the highest increase in spending among high school students was driving schools, with a 176% rise in the number of transactions compared to the previous month. This was followed by accommodation facilities (157%), clothing (98%), photo studios (63%), and department stores (54%).
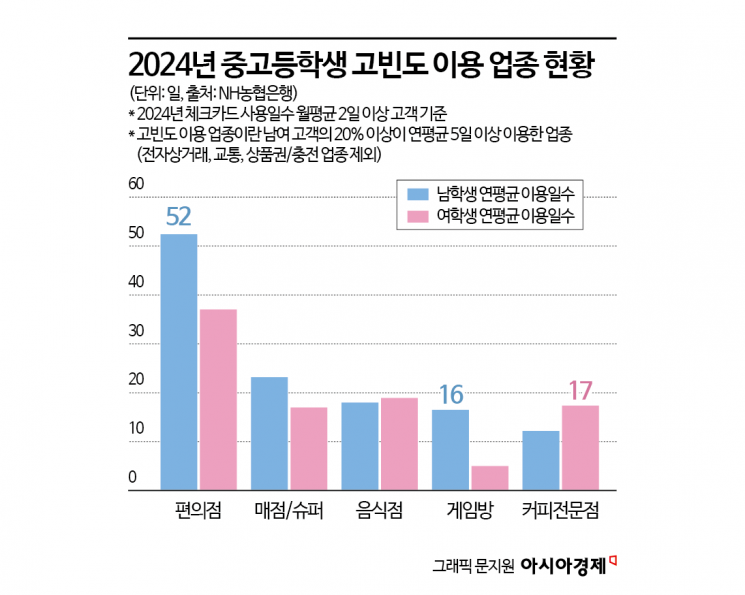
The places most frequently visited by middle and high school students are convenience stores. Male students use them an average of 52 days per year, while female students use them about 38 days per year. Next are snack bars or supermarkets, restaurants, gaming rooms, and coffee shops, in that order. Compared to female students, male students visit convenience stores (52 days) and gaming rooms (16 days) more often, while female students visit coffee shops (17 days) more frequently than male students.
Teenagers are found to consider value for money when drinking coffee. Looking at their coffee shop usage patterns, the number of transactions surges from 12 p.m. (lunchtime), with 4 to 5 p.m. (after school) accounting for about 15% of all transactions. The price range most commonly chosen is between 3,000 and 4,000 won. Transactions between 3,000 and 5,000 won make up 41% of the total. The coffee brand most frequently chosen by teenagers is MegaMGC (Mega Coffee), accounting for 18% of all brand transactions. Compose Coffee (11%) and Paikdabang (10%) followed. NH Nonghyup Bank analyzed that teenagers tend to choose brands that offer larger portions at lower prices.
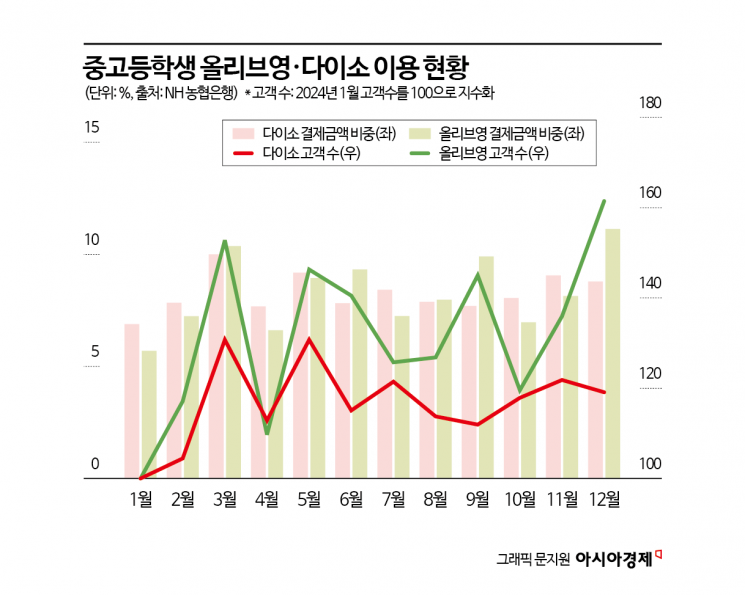
Olive Young and Daiso, considered "hangout spots" for teenagers, showed distinct usage patterns. At Olive Young, both transaction amounts and customer numbers increased in the sale months of March, June, September, and December. In particular, in December last year, the number of customers reached 160 compared to 100 in January. In addition, there was a noticeable increase in the use of online channels as well as offline stores. The proportion of online transaction amounts last year was 14%, double the 7% recorded in 2020. The average amount spent per online transaction was 27,000 won, surpassing the offline average of 16,500 won. At Daiso, March and May, with 130 customers each, were the months with the highest number of visitors.
© The Asia Business Daily(www.asiae.co.kr). All rights reserved.


